- FMA
- The Fabricator
- FABTECH
- Canadian Metalworking
Categories
- Additive Manufacturing
- Aluminum Welding
- Arc Welding
- Assembly and Joining
- Automation and Robotics
- Bending and Forming
- Consumables
- Cutting and Weld Prep
- Electric Vehicles
- En Español
- Finishing
- Hydroforming
- Laser Cutting
- Laser Welding
- Machining
- Manufacturing Software
- Materials Handling
- Metals/Materials
- Oxyfuel Cutting
- Plasma Cutting
- Power Tools
- Punching and Other Holemaking
- Roll Forming
- Safety
- Sawing
- Shearing
- Shop Management
- Testing and Measuring
- Tube and Pipe Fabrication
- Tube and Pipe Production
- Waterjet Cutting
Industry Directory
Webcasts
Podcasts
FAB 40
Advertise
Subscribe
Account Login
Search
Reducing conversion cost in a copper tube mill
Lean initiatives, measurable results
- By David Liddle
- September 11, 2007
- Article
- Tube and Pipe Production
Recent business-sector changes—copper cost increases, globalization, technology advances, and rapidly changing consumer tastes—have had big effects on copper producers and extruders and have led to profound changes in the industry. Change isn't necessarily bad; it brings both risk and opportunity. Changes must be sensed, interpreted, and acted on. Charles Darwin said, "It is not the strongest of the species that survives, nor the most intelligent that survives. It is the one that is the most adaptable to change." This applies to industry today.
Although large size and global coverage can make an organization powerful, power isn't the only ingredient for success. Flexibility, innovation, and speed to market are still important competitive assets.
Copper Prices
Copper prices have more than tripled over the past four years and are not showing any signs of backing off. While growth in some markets stalled, global copper production increased by approximately 20 percent in 2005 and 10 percent in 2006 (see Sidebar).
Going Lean
If you want a new management initiative, you have many to choose from: lean manufacturing, agile, Six Sigma, total quality management (TQM), and so on. You might wonder what falls under the lean umbrella, and how do I achieve it? And how do I avoid initiative overload?
The word lean suggests no fat, or a minimum amount of fat, and applying this to manufacturing implies minimum waste. In other words, remove wasteful processes and keep only activities that add value. While this is logical, actually determining what is valuable and what isn't, and then applying this to all aspects of a business, is difficult.
Often the answers do not lie within the grasp of management but with the employees who are closest to the process and better placed to distinguish value from waste.
Step 1. Lean Business Philosophy. The first step is to take senior members and key decision-makers on a detailed tour of the processes and challenges, ideally through action-based learning simulation. They can then decide whether to support lean initiatives and, if so, develop a vision and implementation strategy.
Many assume that the biggest areas for improvement are in manufacturing processes, but this is not always the case. Most businesses have focused on improving manufacturing for some years and may find further improvements elusive. Improving support areas—maintenance, shipping, receiving, quality engineering, and sales—might actually provide bigger benefits.
Step 2. Culture and Organizational Change. To implement the lean philosophy, you have to take great care of your most important asset: people. Lean's impact on the work force is as big as it is on management, but in completely different ways.
In a lean program, the people who most easily can come to grips with distinguishing between value-adding and non-value-adding activities are the workers. Waste is far easier to track down and remove if you start looking in areas close to where it is created. Such a bottom-up approach must be led by and supported by a visionary senior group and facilitated by middle management.
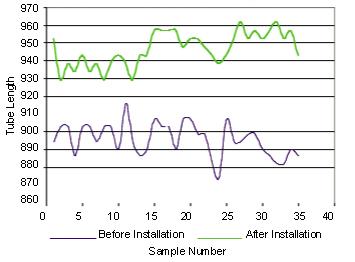
Figure 5The increase in tube length is proof that the producer's quality initiatives resulted in a decreased wall thickness.
It is essential to have a comprehensive education program to ensure that all staff members are coached correctly. This prevents conflict and enables efficient waste removal.
Step 3. Lean Acceptance. This stage involves educating middle management about the lean business philosophy, creating an understanding of how it can be applied, and refocusing them to take on a facilitator role.
At this stage you begin to deal with the cultural and behavioral differences that can exist between management and the work force, as well as management's relinquishing some of the duties and responsibilities of the lean process. Lean cuts across functional and departmental boundaries, which eventually leads to a restructuring of responsibility for the major business processes.
Step 4. Transformation to Lean. You are now ready to move on to application, which involves steps that enable you to focus on the higher-level issues: people, education, support, and approach.
At this point you need to form several teams. Some team members will come from the process under analysis and will receive the initial education and training. A minority of team members will come from outside to act as objective evaluators. The Oliver Wight approach is to run an action-based learning event to educate the team members, who are supported by middle management. The key here is not to take ownership of the plan, but to provide conditions in which the team can implement lean initiatives. A nucleus of people trained in the lean tools and techniques then, with some external support, can help others create lean processes.
Step 5. Sustainability. Lack of sustainability is a frequent problem with any recently adopted business philosophy. Often sustainability fades because something crucial is lacking: commitment by senior management; understanding lean initiatives; or alignment to the strategy.
This is why it is crucial that management embraces lean. Lean can be achieved only through behavioral and cultural change.
Overall Equipment Effectiveness (OEE)
OEE is part of the lean manufacturing toolkit; in particular, it is part of total productive maintenance (TPM). TPM is a lean manufacturing tool that enables maintenance department personnel to be responsible not just for fixing breakdowns, but to take a role in increasing throughput, improving quality, and cutting costs.
OEE is primarily a metric for measuring improvement. It focuses on three primary areas: availability, performance, and quality.
- Availability is machine or process uptime.
- Performance concerns the speed of the process. It also measures how quickly the process recovers from minor stoppages.
- Quality refers to the first-pass yield, a measure of precision, and production yield, a measure of repeatability.
Five Elements Essential for Availability
Five elements necessary for availability are sort, set in order, shine, standardize, and sustain. The elements, commonly known as 5S, tend to do more for availability,
performance, quality, and morale than any other lean manufacturing tool. 5S is low-hanging fruit.
- Sort. Remove all items from the workstation that are not needed for current production.
- Set in Order. Arrange tools and supplies so that they are easy to find.
- Shine. Make sure everything is clean, functioning, and ready to go.
- Standardize. Develop a single, consistent plan for maintaining the first 3S's.
- Sustain. Continue to use correct procedures.
Studies have shown that the average person at work spends 30 seconds out of each five minutes looking for something. This adds up to 45 minutes every eight-hour shift.
After implementing 5S, it is likely that you will adopt a more formal continuous improvement program. DMAIC is a good place to start. Such a program requires you to define the process or problem to be analyzed. The second step is to measure baselines to determine the current process's performance. The third step is to analyze the data collected in the measuring phase to determine root causes of problems. The fourth step is to improve the process by attacking the root causes. The fifth step is to put a control mechanism in place to ensure the program does not regress over time.
Improving Product Quality in a Copper Mill
Copper tube quality comprises several characteristics, such as grain structure, surface finish, and concentricity. Following is a look at improving the last one, concentricity.
What are eccentricity and concentricity? Eccentricity is the term used to describe the position of the center of a profile relative to some datum point. It is a vector quantity in that it has magnitude and direction. The magnitude of the eccentricity is expressed as the distance between the datum point and profile center. The direction is expressed as an angle from the datum point to the profile center.
Concentricity is twice the eccentricity and is the diameter of a circle traced by the component center orbiting about the datum axis.
The percentage of the eccentricity is calculated by finding the difference in the maximum and minimum wall thickness (WT) and dividing this difference by the sum of the maximum and minimum wall thickness, as follows:
Percent Eccentricity = (Max WT – Min. WT) / (Max. WT + Min. WT)
After finding the root causes for tube eccentricity, a copper tube producer implemented a quality control program in two steps: equipment installation and tooling change. The tube in this case had a piece weight of 350 kg, a density of 8,900 kg/m3, an OD of 15 mm, and a WT of 1 mm. This producer collected three data sets—baseline data, data after the equipment installation, and data after the tooling change. The equipment installation and tooling change reduced the eccentricity by half, from 5.1 percent to 2.5 percent (seeFigures 1, 2, 3, and 4). The mean WT for five samples fell from 0.998 mm to 0.931 mm, and the standard deviation for WT fell from 0.0057 mm to 0.0042 mm.
The equipment upgrade and tooling change produced not only better tube, but more tube. Each input (every 350-kg piece) now produces an average of 66.5 additional meters of tube output (see Figures 5 and Figure 6).
Copper Prices
Global copper prices are being kept elevated by speculators and production in the world's two largest copper-consuming countries, China and the U.S.
Here's why:
- Investment fund managers who want to diversify their portfolios are pumping more money into precious and commodity metal markets, especially gold, copper, aluminum, and zinc.
- These are boom times in the Chinese economy, which has experienced strong demand for copper, brass, and bronze materials used in the construction, utility, and automotive sectors.
- The U.S. has experienced increases in consumer spending for durable goods; federal government spending; and investment in equipment, software, and private construction.
According to producer price data from the Bureau of Labor Statistics, copper prices nearly tripled in the four years from May 2003 to May 2007, and copper scrap prices increased more than fourfold in the same time.
While copper prices in 2007 haven't been as high as they were in 2006, the volatility continues. The International Herald Tribune reported in early January that the drop in U.S. construction was putting downward pressure on copper prices, which already had been sliding for three months. It reported that the copper price for delivery in three months was $5,855 per metric ton. At that time many analysts were predicting that a combination of decreasing demand and increasing inventories would cause copper prices to remain steady or fall throughout 2007.
As it turned out, copper inventories fell from January to June (from nearly 193,000 metric tons to approximately 124,000 metric tons, according to the London Metal Exchange) and prices raced upward. The price per ton for three-month delivery averaged $7,400 in June, according to the LME.
The price increase was driven in part by a strike at Codelco, the world's largest copper miner which produces nearly a third of Chile's total copper output.
The editors of TPJ-The Tube & Pipe Journal® thank the Tube & Pipe Association, International®'s Extrusion, Drawing & Tube Reducing Technology Council for its efforts in soliciting this article.
About the Author
David Liddle
Henson Close South Church Enterprise Park
Bishop Auckland, Co. Durham DL14 6WA
+44-1388-771-300
About the Publication
subscribe now
The Tube and Pipe Journal became the first magazine dedicated to serving the metal tube and pipe industry in 1990. Today, it remains the only North American publication devoted to this industry, and it has become the most trusted source of information for tube and pipe professionals.
start your free subscription- Stay connected from anywhere
Easily access valuable industry resources now with full access to the digital edition of The Fabricator.

Easily access valuable industry resources now with full access to the digital edition of The Welder.
Easily access valuable industry resources now with full access to the digital edition of The Tube and Pipe Journal.
- Podcasting
- Podcast:
- The Fabricator Podcast
- Published:
- 04/16/2024
- Running Time:
- 63:29
In this episode of The Fabricator Podcast, Caleb Chamberlain, co-founder and CEO of OSH Cut, discusses his company’s...
- Trending Articles
Team Industries names director of advanced technology and manufacturing

3D laser tube cutting system available in 3, 4, or 5 kW

Corrosion-inhibiting coating can be peeled off after use
Zekelman Industries to invest $120 million in Arkansas expansion

Brushless copper tubing cutter adjusts to ODs up to 2-1/8 in.

- Industry Events
16th Annual Safety Conference
- April 30 - May 1, 2024
- Elgin,
Pipe and Tube Conference
- May 21 - 22, 2024
- Omaha, NE
World-Class Roll Forming Workshop
- June 5 - 6, 2024
- Louisville, KY
Advanced Laser Application Workshop
- June 25 - 27, 2024
- Novi, MI

