Contributing Writer
- FMA
- The Fabricator
- FABTECH
- Canadian Metalworking
Categories
- Additive Manufacturing
- Aluminum Welding
- Arc Welding
- Assembly and Joining
- Automation and Robotics
- Bending and Forming
- Consumables
- Cutting and Weld Prep
- Electric Vehicles
- En Español
- Finishing
- Hydroforming
- Laser Cutting
- Laser Welding
- Machining
- Manufacturing Software
- Materials Handling
- Metals/Materials
- Oxyfuel Cutting
- Plasma Cutting
- Power Tools
- Punching and Other Holemaking
- Roll Forming
- Safety
- Sawing
- Shearing
- Shop Management
- Testing and Measuring
- Tube and Pipe Fabrication
- Tube and Pipe Production
- Waterjet Cutting
Industry Directory
Webcasts
Podcasts
FAB 40
Advertise
Subscribe
Account Login
Search
Controlling stamping processes with statistical logic
The load monitor's role in SPC
- By Richard Wilhelm
- June 27, 2002
- Article
- Bending and Forming
Analyzing signals seems to be a bigger part of our lives these days. We watch for interest rate changes, new-home start-ups, the jobless rate, Dow Jones activity, auto sales, steel prices, tax cuts, and more.
These signals help us to make decisions to keep our business open and, it is hoped, profitable. Ignoring the signals can result in missed opportunities to plan ahead and stay ahead of the game.
Overseeing a stamping operation requires the same attention to signals so that we can see what's ahead and make smart decisions to avoid problems and improve operations. Manufacturing statistics—information collected in samples—provide clear and powerful signals about what's going on and what we should do next.
Examining an operation using statistical signals, most notably statistical process control (SPC) charts, is one way to determine how much the process varies throughout the production run. Reducing this variation generally improves the quality of the stamping process.
One important signal available from every stamping operation is the load required to produce the part. Whether the process involves blanking, forming, drawing, or coining, a certain amount of force, or load, is generated to produce a quality part.
Load changes that result, for example, from material variation or tool wear affect the dimensional characteristics of the part. Therefore, load measurement is statistically relevant, and certain decisions can be made for a stamping operation based on the load variations for each part produced.
In a stamping operation, a certain amount of load variation from hit to hit is typical. Material, lubricant, tooling, and press conditions cause some of the variation. Press load monitors are effective tools for measuring how much the load varies during each machine cycle. These monitors are even more effective when their upper and lower control limits are set to stop the press if the limits are exceeded.
Converting Load Data to Statistical Format
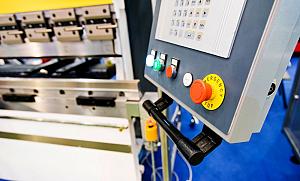
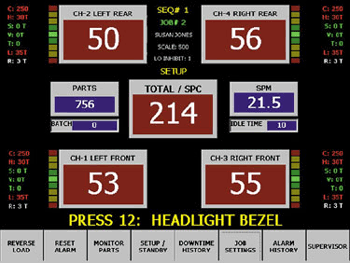
Load monitors on straight-side presses typically have five digital readouts to indicate the load on each of the four corners—or connections, depending on sensor location—plus the total load (see Figure 1).
Some monitors use a bar graph or trend display to indicate load variation from hit to hit based on sample loads taken during setup. Like a traffic light, the trend colors change from green to amber to red as the load changes above or below the original sample's limits. If the load varies from the trend control limits, the machine will shut down.
While effective, these bar graph displays offer only a snapshot of the process because they normally indicate load variation from the sample based only on the last part produced.
Through the use of embedded personal computer technology, load monitors now can store the load values for each part produced in the entire production run. This can be accomplished even at press speeds higher than 1,000 strokes per minute (SPM). Using a menu-driven color touchscreen display, the monitor shows the total load variation from hit to hit on a broken-line graph. The graph indicates how the load behaves at a point in the process or over the entire production run.
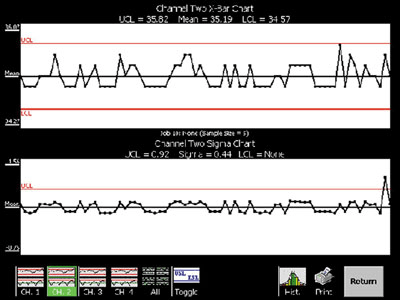
This load data then can be expressed in a statistical format using average X-bar and sigma charts. The top chart in Figure 2is the X-bar, or the average load measured for each part produced during the run. The pattern of these measurements on the chart is called a distribution.
The bottom sigma, or s, chart measures load variability in the process. This chart uses standard deviation to show the difference between the smallest and largest load values measured during the production run. Because standard deviation measures the amount of variability, it can be used as the basis for determining the load monitor's upper control limit (UCL) and lower control limit (LCL).
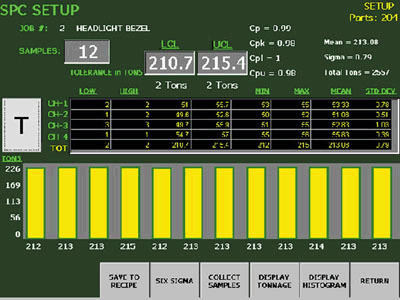
The initial sample size can be selected from a setup screen (see Figure 3). The overall peak load measured for each part in the sample is shown in a bar graph format. The individual corner load values are shown in a table above the bar graph along with the corresponding minimum and maximum values, mean, and standard deviation. This table indicates which load monitor channel is experiencing the most load variation from hit to hit. This could show that the tool has not been properly set.
In almost all distributions, all the measurements fall within three standard deviations of the mean. For this reason, almost all control charts' limits are set at ±3 standard deviations above and below the mean value.
Applying this concept to load measurements suggests that all measured load values also should fall within ±3 standard deviations. Depressing the Six Sigma selection key on the sample screen sets both the UCL and LCL based on ±3 standard deviations of mean. If the load exceeds any limit, the instrument will initiate a machine shutdown because the process will be considered out of control.
Using statistical methodology to establish control limits in the load monitor puts the same process capability expectations on the stamping operations as on all the other processes in the plant. Plus, setting control limits based on SPC logic eliminates trial and error.
All other SPC tools can be applied too. The data collected in the X-bar and standard deviation charts can be displayed using a histogram, which shows the comparative frequency of the load values. Load values are shown on one axis, and the number of parts produced is Cpk level of 1.3. With this as a goal, operators, tool engineers, and maintenance personnel can work as a team to identify and reduce the process variations that cause lower Cpk values. This is why the high and low load values taken during the sample are used as specification limits, even though they don't correlate to specific part dimensions.
To establish true specification limits, in-die dimensional measurements on the part are required. Multiple analog inputs are available in the load monitor to accept an array of in-die sensors, such as eddy current probes, lasers, photocells, thermocouples, and resistance temperature detectors (RTDs). These sensors can measure part dimension as well as surface finish.
Of course, the most valuable in-die sensor options are strain gauge load cells or die plugs. The latter easily can be installed in progressive dies and transfer tools. In fact, these in-die force sensors could replace the bolt-on transducers located on the press structure.
Getting to the Root Cause
Documenting the reasons that a process exceeded a control limit is important. The details of each occurrence can be entered in the load monitor on the downtime history screen.
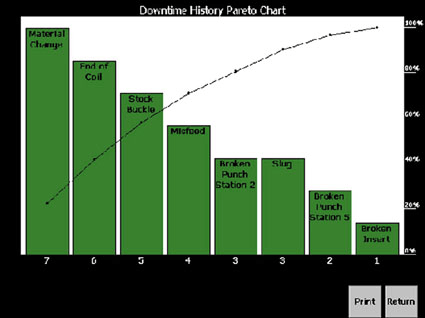
The most probable causes are listed for the operator to select. An alarm history screen summarizes the out-of-tolerance occurrences along with the reasons for them. At the end, or at any time during the production run, a Pareto chart can be graphed. This bar graph ranks problems in decreasing order of frequency.
When a tonnage alarm history is done for a Pareto chart (see Figure 4), the number of tonnage alarms is displayed on the left vertical scale; the accumulated percentage of alarms is shown on the right vertical scale. The different categories are shown on the horizontal scale.
These Pareto charts based on the entire production run are significant because they separate the important alarm reasons from the many insignificant ones. Plus, the Pareto charts look at the overall occurrences over the run. Too often the most recent cause for machine downtime gets all the attention. Used effectively, Pareto charts can identify root cause variation.
Proof of Quality
More and more companies are demanding proof of quality, or validation that a process was under control. This proof can be provided through hard copy printouts of the control charts from the stamping presses. They show the mean, standard deviation, and capability information of the load measurements.
Printouts of histograms, which depict the load measurement distribution, can be generated too. Charts can be generated on a network printer based on the lot, batch, total, or any combination of parts that comprise the shipment to a customer. Their inclusion with the shipment will be well-received by the customer.
The transfer of SPC data from the load monitor does not stop here. An Ethernet port enables the monitor to export data in the industry-standard extensible markup language (XML) format. With this provision, information can be viewed on a Web browser or written to a database. With the Ethernet connection, various charts, capability studies, and database information can be sent to either an intranet or Internet location.
The Tools of Statistics
The charts and studies described here are just a few of the many statistical measurements that can be taken from a stamping process. Their use does not guarantee that zero-defect status can be achieved.
Instead, control charts, capability studies, histograms, and Pareto charts should be considered analytical tools that provide a better understanding of what happens during a stamping process. More important, they're tools that can measure and track performance against a standard or a benchmark.
Since their introduction about 40 years ago, load monitors have protected presses and tooling, helped reduce setup time, detected scrap and material variation, and identified abnormal press and tool conditions. As the demands for achieving zero defects force stampers to apply more statistical measurements to their processes, one more benefit of measuring load can be added to the list.
When load is used as a statistical signal, the capability of a stamping operation can be measured and tracked throughout the run. More important, the output from a load monitor can be expressed using the same statistical language used by other processes in the plant. Load should be considered as one more signal used as a statistical measurement on which decisions can be based.
About the Author
Richard Wilhelm
361 Dussel Drive
Maumee, OH 43537
419-893-4356
Related Companies
subscribe now

The Fabricator is North America's leading magazine for the metal forming and fabricating industry. The magazine delivers the news, technical articles, and case histories that enable fabricators to do their jobs more efficiently. The Fabricator has served the industry since 1970.
start your free subscription- Stay connected from anywhere

Easily access valuable industry resources now with full access to the digital edition of The Fabricator.

Easily access valuable industry resources now with full access to the digital edition of The Welder.

Easily access valuable industry resources now with full access to the digital edition of The Tube and Pipe Journal.
- Podcasting
- Podcast:
- The Fabricator Podcast
- Published:
- 04/16/2024
- Running Time:
- 63:29
In this episode of The Fabricator Podcast, Caleb Chamberlain, co-founder and CEO of OSH Cut, discusses his company’s...
- Trending Articles
AI, machine learning, and the future of metal fabrication

Employee ownership: The best way to ensure engagement

Steel industry reacts to Nucor’s new weekly published HRC price

Dynamic Metal blossoms with each passing year

Metal fabrication management: A guide for new supervisors

- Industry Events
16th Annual Safety Conference
- April 30 - May 1, 2024
- Elgin,
Pipe and Tube Conference
- May 21 - 22, 2024
- Omaha, NE
World-Class Roll Forming Workshop
- June 5 - 6, 2024
- Louisville, KY
Advanced Laser Application Workshop
- June 25 - 27, 2024
- Novi, MI


