Laser welding 201
The role of process optimization and training in laser welding applications
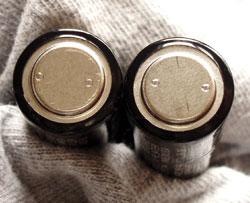
A battery component is secured in place with two laser spot welds.
Laser welding technology has entered a new state, in which optimization of the equipment and the process is relatively easy to perform, and may result in higher profits and a competitive edge in global manufacturing. The availability of fast, accurate, and reliable laser beam diagnostic and process-monitoring devices is what makes optimization possible. Proper training is needed to safely and effectively operate such devices to ensure that full optimization is realized.
To remain competitive locally and globally, it is no longer sufficient to just run the laser welding process. Often the equipment can deliver higher productivity and a better-quality product at little or no added cost, simply by optimizing the operation of the laser to suit the welding process. Most laser beam diagnostic devices are still operated in the open-loop mode; however, they can be set to turn on alarms when the preset operating limits are exceeded.
Optimization: An Example
To get the best weld quality and maximum productivity from the laser, you can use diagnostic devices to optimize certain characteristics of the laser beam to match the requirements of the laser welding process. These parameters are:
- Temporal profile (pulse shape) of pulsed lasers.
- Temporal behavior of the laser (such as ramping and modulating).
- Spatial profile of the laser beam (of both pulsed and CW lasers). Spatial profile refers to the distribution of laser energy or laser power transversely across the beam. It has a direct bearing on the focusability of the laser beam.
A high-speed, high-volume manufacturer of a common consumer product optimized the temporal profile of a pulsed laser and achieved significant improvement in weld quality and savings in consumables cost. The manufacturer used an electrically pulsed Nd:YAG laser with pulse-shaping capability. The pulse shape is square, and the maximum power rating of the laser is 200 watts, which equals 10 pulses per second, each pulse having 20 joules of energy. Weld geometry is a lap weld, and both materials are chrome-plated carbon steel. With the top piece being 0.003 inch thick and the bottom 0.010 in. thick, the maximum allowable gap between the pieces is 0.0003 in. Weld quality requirements include good electrical conductivity, good mechanical strength, and an aesthetically clean weld.
One of the problems the manufacturer faced was the lack of fusion between the two plates, which resulted in poor strength (as tested with a simple peel test) and poor electrical conductivity. When the laser power was turned up to 100 percent supply capacity to compensate for the lack of fusion, some improvement was achieved, but some of the top plates would burn through. The increase in output power also resulted in a significant reduction in flash lamp life, as lamps had to be changed every 60 hours. The reject rate was 600 parts per million, or 0.6 percent.
Both the lack of fusion and the burn-through were caused by excessive gap between the pieces. The maximum recommended gap is 0.0003 in., or 10 percent of the thickness of the top plate. There were two main reasons for the gap. First, the pieces may have been warped, and second, the tooling was worn. Neither source was easy to fix.
If there were no gap, it should take only 4.5 joules to make each weld, or a total of 9.0 joules for the two welds. Since the laser was operated at 20 joules per pulse, the lifetime of the flash lamps was shortened significantly.
Resolution. According to a recently published article,1 a special pulse shape may help to bridge a gap as large as the thickness of the top plate. The manufacturer decided to try the recommended pulse shape, because the laser had the ability to generate various pulse shapes.
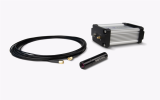
Because the temporal profile (pulse shape) of the actual laser pulses may not be the same as the pulse shape programmed on the controller, it was desirable to measure the actual pulses with independent means. Several ISO technical standards also recommend using independent methods. The manufacturer chose an energy meter capable of measuring the temporal profile and the temporal characteristics of the laser beam independently of the laser power supply. It also was able to measure other laser parameters as well, such as energy per pulse, pulse rate, average power, and stability of the laser power.
The laser was programmed with a four-sector pulse having a shape as shown in Figure 1. The meter showed that the shape of the optical laser pulses was not the same as the programmed pulse shape. The first and the third sectors of the resultant pulse shape were of different widths and heights. This was not an unusual case.
Figure 1The diagram shows the programmed and actual temporal profile of the laser pulses. The programmed pulse was measured directly at the laser power supply.
By monitoring the optical pulse shape in real time, the manufacturer changed the power supply settings to achieve the desired pulse shape (see Figure 2). Note that the shape of the final programmed pulse was totally different from what the laser was delivering. Thus, the (older-model) laser was "tricked"into generating the correct pulse shape.
Results. The rejection rate caused by incomplete fusion and burn-through was reduced to less than 100 parts per million, or 0.01 percent. Peel test force was increased by 20 percent to 100 percent higher than product specifications. It was the parent material that failed in all cases. Due to the more efficient use of the energy of the pulses, energy per pulse (before splitting) was reduced to 10.0 joules (previously 20.0 joules), and the lamp life was extended to 360 hours, or 13 million shots (previously 60 hours). The cost savings resulting from extended lamp life on several systems, operating 24 hours a day, seven days a week over a period of three months, was $10,000.
Optimization Training
This case history is a relatively simple application of one of the beam diagnostic devices that can optimize the laser welding process by tailoring the temporal profile of the laser pulses. The fact is that using the various diagnostic devices requires formal training and practice. Live demonstrations by the equipment manufacturer simply are not enough. Self-training is not very efficient, either, and may in fact expose the user to laser-related safety hazards.
Training is needed to operate and use beam diagnostic devices and to interpret the data collected. Training also is needed to adjust and calibrate the laser and the beam delivery devices. Finally, it is also required to generate ISO-compliant documentation.
This type of training usually is offered by local community colleges. However, except for a few geographic areas in the U.S., the volume of industrial laser installations does not justify regular courses at community colleges. Also, colleges typically do not have the trained faculty and staff.
A course that covers all the training needs mentioned previously, after the user has learned how to operate the diagnostic device, is the Department of Engineering Professional Development (EPD), University of Wisconsin, Madison's laser welding certification program. This program is the follow-up to the laser welding equipment and process validation courses that have been offered by EPD for more than 29 years, and the laser beam diagnostics courses that have been offered for nearly four years. Several groups of people who attended the laser courses at EPD already have graduated from the laser welding certification program, and the increasing enrollment speaks of its success.
It is interesting to observe that most of the course participants and the people who have gone through the certification program are engineers, technicians, and some managers from companies that are end users or systems integrators. Many end users of lasers have made the connection between the use of beam diagnostic devices and profitability.
Figure 2Click to view image larger The diagram shows the programmed and actual temporal profile of the laser pulses. The programmed pulse was measured directly at the laser power supply
About the Author
About the Publication

subscribe now

The Welder, formerly known as Practical Welding Today, is a showcase of the real people who make the products we use and work with every day. This magazine has served the welding community in North America well for more than 20 years.
start your free subscription- Stay connected from anywhere

Easily access valuable industry resources now with full access to the digital edition of The Fabricator.

Easily access valuable industry resources now with full access to the digital edition of The Welder.

Easily access valuable industry resources now with full access to the digital edition of The Tube and Pipe Journal.

Easily access valuable industry resources now with full access to the digital edition of The Fabricator en Español.
- Podcasting

In this episode of The Fabricator Podcast, Caleb Chamberlain, co-founder and CEO of OSH Cut, discusses his company’s...