Contributing Writer
 |
Their focus on time requires that material flow smoothly through the production processes in concert with sales orders, raw materials, and purchased parts. It also requires smaller production batch sizes. Most important, these companies have learned that the greatest waste and excess costs don't result from value-adding steps themselves, but from the gaps between the value-adding steps.
These competitors have managed to eliminate or substantially reduce the gaps caused by the major stamping operating problems shown in Figure 1. This in turn shortens cycle times, which reduces the time it takes to convert an order into cash. By focusing on the value-creation processes, these stamping plants have increased throughput and provided additional capacity at bottlenecks.
To close these gaps, you must identify their root causes and develop and implement solutions to the problems.
 |
| Figure 1 |
The first step is to establish measurements that are easily understood by everyone at all levels in the organization.
One easily understood measurement is the amount of time required to convert an order into cash. Actions that shorten the time add value. Actions that lengthen the time do not add value. It is in this context that value creation yields the desired result in the shortest period of time.
You can obtain the initial time target from either standard or job cost information and then chart the value-adding time—that which the customer pays for—on a time line (see Figure 2).
The best way to assess the effectiveness of an operation is to determine how much time a stamping order should take to run compared to the actual time. For example, if the job should be completed in a day and it takes three days of press time, a number of non-value-adding activities are occurring that must be eliminated.
 |
| Figure 2 One easily understood measurement is the amount of time required to convert an order into cash. A time line can be created to chart value-adding time. |
The next step is to determine how much you can improve performance by comparing the value-adding time with the amount of time a job actually takes. You can analyze and compare actual capacity utilization with the capacity required to perform the job requirements at standard rates. After collecting the data, display it in a manner understood by everyone.
This capacity analysis is not difficult. If, for example, a machine is scheduled to produce for 40 hours during the week, your expectation is that it will make the equivalent of 40 hours' worth of parts. If it is producing parts during only 25 of the scheduled 40 hours, production is not meeting your expectation, and effective utilization is only 63 percent.
Figures 3a and 3b provide a comparison of actual capacity utilized and that allowed by the standards. Figure 3a shows the company's current performance, while Figure 3b shows what performance will be when the gaps between the value-adding steps are eliminated.
The next step is to identify the functions or activities occurring in the stamping operation during the 15 hours the machine was scheduled to produce but was not making parts. Most of the performance data and information can be located in company records. If it's not, you can do an industrial engineering study on the production floor to collect actual data from observations on a real-time basis.
As illustrated in Figure 3b, improving performance will free up a lot of capacity and simultaneously reduce operating cost, lower cycle times, and speed the time between conversion of an order and issuance of the invoice.
 |
| Figure 3 (a) This chart shows the company's current performance. (b) Improving performance frees up a lot of capacity and simultaneously reduces operating cost, lowers cycle times, and speeds the conversion of an order to the issuance of the invoice. |
The initial step in the value-creation process is to attack the manufacturing processes that create capacity constraints. You must initiate improvements in these areas before you can make major strides toward increasing profitability and company value.
Stampers often are prevented from achieving these improvements by some very powerful constraints (anything that prevents the company from shortening the cycle from receipt of order to receipt of cash) in the following areas:
Work centers such as those depicted by Figure 3, in which demand is near or beyond capacity, are categorized as bottleneck operations. Bottleneck operations prevent performance from matching expectations and are the initial areas for process improvements. If the bottleneck produces only 50 units per hour, it establishes a ceiling on the sales volume, regardless of available capacities of other operations.
Schedulers often schedule plant resources to meet demand. Many uncontrollable variables and random events, however, affect the scheduling and staffing. The end result is increased operating cost for the primary operations and excess capacity at secondary operations, which are fully staffed with little recognition of the limitations at bottleneck operations.
In a typical stamping plant, secondary operations include degreasing, coating, welding, assembly, and insert molding. Many plants have backlogs at the presses but little or no work at the downstream operations, which are staffed to produce parts in accordance with delivery requirements.
Bottleneck operations at stamping presses have the following adverse effects:
In a stamping plant, the activities that have the primary impact on the revenue stream happen at the press. The only value-adding activity that this capital-intensive machine provides is producing stamped parts of acceptable quality. Other activities do not add value—they don't earn standard hours or absorb overhead expense. They only lengthen the cycle time (which reduces throughput), increase operating cost, raise inventory, and lower customer service levels.
The next step is to analyze the bottleneck processes and separate the value-adding work activities from those that do not add value.
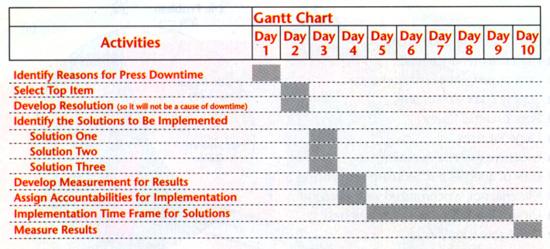 |
| Figure 4 To ensure the benefits of the solution implementation phase are achieved, measure all results and develop a timetable for completion. For example, a Gantt chart can help the team track its progress against the schedule. |
A good way to get started is to select one issue that, when resolved, will increase throughput, reduce operating cost, or lower inventory. Create a key action plan that starts with the process improvement item. Most process improvement items require more than one person to develop a solution, so a team approach may be needed.
Depending on the issue selected, the process improvement team may comprise representatives from production, scheduling, engineering, maintenance, inventory, material management, tooling, and accounting.
The team's initial steps are to frame the problem and identify the constraints that, when resolved, will improve the process. For example, if the issue is to increase capacity utilization, the team identifies those things that prevent increasing capacity utilization.
The team works as a group to develop solutions for each constraint and then identifies the action items required to implement each solution. These action items are assigned to team members based on their individual skills and departments. The benefits are identified in terms such as the expected amount of cycle time reduction or production capacity gain.
To ensure the benefits of the solution implementation phase are achieved, the team should measure results and develop a timetable for completion. A Gantt chart can help the team track its progress against the schedule (see Figure 4). Return on investment and payback analyses might be required if capital expenditures are needed to resolve the issue.
The process improvement team meets periodically to assess progress against the timetable and to determine if the objectives of the key action plan are being achieved. If progress is not being made according to expectations, emerging constraints may become evident that the team did not identify in its early meetings. If so, the team must approach and resolve the new constraints as it did the initial constraints.
When the team achieves the goals of the first key action plan, it will be inspired to accept the next challenge on the priority list, thereby essentially embarking on a continuous improvement program. As the team gains experience and confidence, it can begin to take on more difficult tasks, such as lean thinking, synchronous manufacturing, and demand flow technology, with the ultimate goal of bringing the operations to world-class levels of performance.
Frank G. Rubury is president of The Rubury Company, P.O. Box 1240, Dover, NJ 07802, 973-726-9007, fax 973-726-9490, ruburyco@ptd.net.


The Fabricator is North America's leading magazine for the metal forming and fabricating industry. The magazine delivers the news, technical articles, and case histories that enable fabricators to do their jobs more efficiently. The Fabricator has served the industry since 1970.
start your free subscription
Easily access valuable industry resources now with full access to the digital edition of The Fabricator.

Easily access valuable industry resources now with full access to the digital edition of The Welder.

Easily access valuable industry resources now with full access to the digital edition of The Tube and Pipe Journal.

Easily access valuable industry resources now with full access to the digital edition of The Fabricator en Español.
In this episode of The Fabricator Podcast, Caleb Chamberlain, co-founder and CEO of OSH Cut, discusses his company’s...