


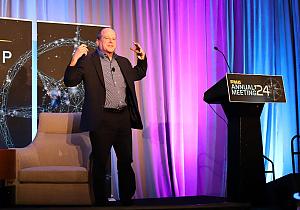


Lean Consultant

Value stream mapping (VSM), as defined by the Lean Enterprise Institute, is a simple diagram of every step involved in the material and information flows needed to bring a product from order to delivery. In other words, VSM is an invaluable tool used to identify waste in day-to-day operations.
This topic has been addressed many times in regards to mass producers with low variety, but what about the small to midsize manufacturers working in a high-mix, low-volume (HMLV) environment?
Following are specific steps smaller companies can take to prepare for and achieve VSM.
Before moving ahead with VSM, be sure to gather the following information:
This information will be useful in creating a history of your product mix, and the volume of sales for each product will help you apply Pareto's 80-20 rule. In most cases, you will find that 20 percent of what you build represents 80 percent of your business in a typical year. For example, an analysis for a company revealed that although the company offered more than 100 different base products, only five made up 72 percent of its overall business. In this case, company management initially decided to limit the value stream map to those five base products.
However, when management looked at the sales goals for the next year, three of the base products had targeted sales numbers that varied by 5 percent, and two new products with large projected sales volumes were planned for release. As a result, the analysis was modified so that seven out of the total number of base products amounted to 86 percent of the total business. This was the final analysis by which company management limited the scope of its value stream mapping activity.
To create a product quantity routing analysis, start by listing all of your customers and the products you build for each of them. Be sure to stick to the basics when it comes to your products. Don't get bogged down with the various options that can be added to your base product. List your base standard products that differ in form, fit, and function.
Referencing your sales from the previous year, determine the volume for each product you made for your customers. Calculate the total number of products made, showing the volume of business generated from each customer to understand what your base demand was for the prior year. In Figure 1, for instance, the total is 125 units.
Determine the percentage of business that each product represents from your total number of units sold, and then identify the mix of products that represents around 80 percent of your business. That mix will be what you want to VSM, which will allow you to begin thinking of what a model line will look like in your operation. In other words, by value stream mapping the 20 percent of the products that represent 80 percent of your business, you can identify and eliminate waste from these in-demand products so that a majority of your business becomes more efficient.
If you are a piece-part manufacturer (PPM), you also should start the process by making a list of your customers. Use that list to calculate the total number of finished piece parts you produced from the previous year. Then determine the percentage of business that each customer represents from the volume of parts you produced. Figure 2 shows an example of the calculations.
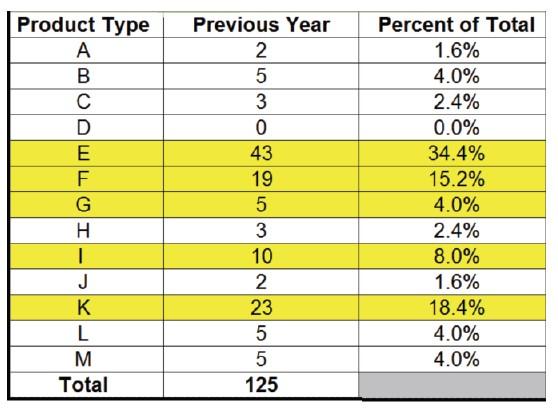
FIGURE 1 Before value stream mapping can occur, you need to determine base demand for products.
The next step is to group your customers together by the industry they represent. Figure 3 shows the total number of finished piece parts along with the total percentage of finished piece parts that each industry represents.
Sort out the number of material types by each industry and determine how many parts account for each type. By concentrating on the largest product families rather than all of them, you can make your VSM efforts go much more smoothly. Notice in Figure 3, the recreational vehicle (RV) industry has both aluminum parts and steel parts. (This scenario is very common for a PPM.) In this case, simply determine how many parts from the RV industry are aluminum and how many are steel. You do not need to keep all the customer's parts together.
The purpose of this exercise is to identify which product families you want to map. Many PPMs do not know what their product families are, and if you try to map every product family at once in a HMLV environment, it will become too complicated.
The next step before VSM is to construct a process quantity routing analysis to identify product families according to a similar build sequence. With this information, you will know exactly what you are mapping through the flow of your operations.
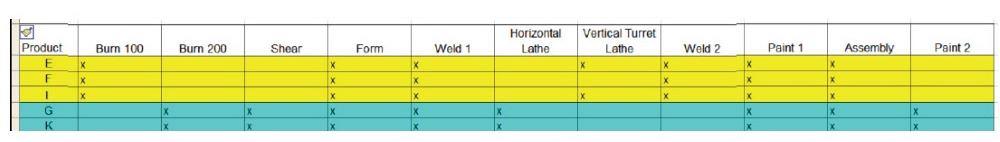
Let's say you have a variety of work centers through which your end products flow for processing (see Figure 4). Of course, you need to know what parts or products flow through each work center and in what order. This chart helps to determine that. You have to know what parts or products flow through each work center and in what order. This helps you see which products follow the same routing sequence that logically make sense to group together. You might need to look at drawings you use to build the product to ensure you understand the routing of parts through the work centers.
Once you have this data, sort it by work center (see Figure 5). Notice the build sequences for two separate product families that are very similar. This results in two distinct product families that have nearly identical build sequences.
It is important to know what products or piece parts comprise 80 percent of your business and which products or piece parts of that 80 percent make sense to group together as a value stream (product family). Start by value stream mapping one value stream at a time to keep things simple. You may find that although your analysis is examining 80 percent of what you build, it might be useful to group together products or piece parts from the other 20 percent with other value streams. This could arise because they follow the same build sequence and have similar form, fit, and function. Don't be so militant in following the 80-20 rule that you don't leave room for flexibility when opportunities arise that are logical to include in your analysis
So, when choosing a value stream to start with, consider the impact that value stream has on the business unit, such as:
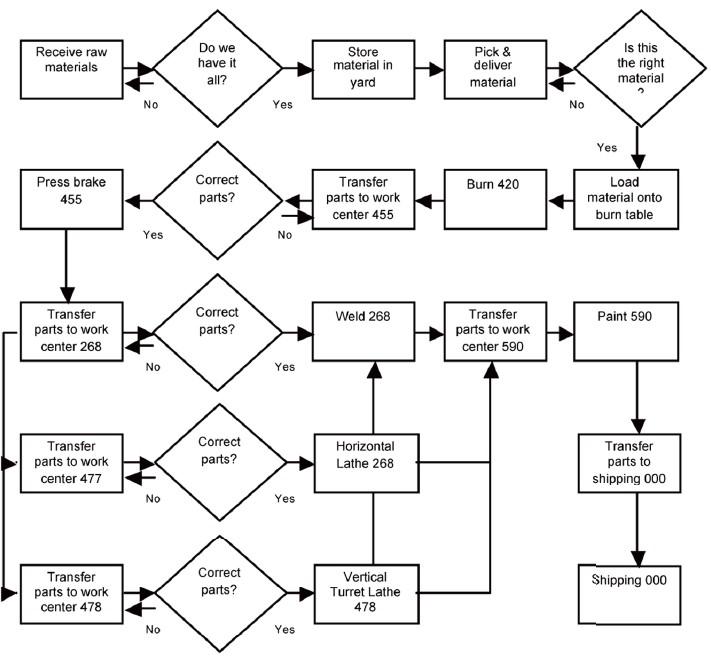
Next, create a flow chart of all the operations in your value stream. Refer to work order routings or the bill of materials for the product value stream as needed to identify the steps and create a starting point.
Figure 6 is a sample flow chart for a hypothetical value stream at a PPM. Notice that this flow chart uses the work center number for each step where applicable as assigned in materials resource planning (MRP), such as "Burn 420," rather than simply "Burn." Using this numerical labeling ensures that if there is more than one burn table in your shop, for instance, everyone in your organization will understand which one is being referenced.
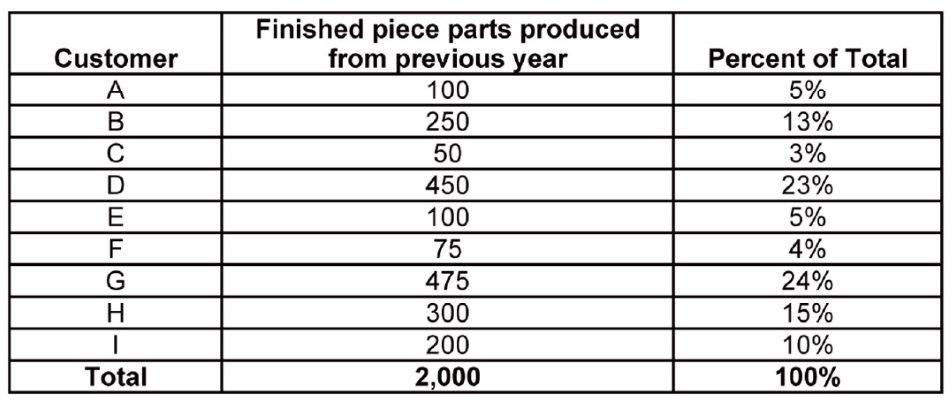
FIGURE 2 The picture of annual piece-part production grows clearer when customer orders are broken down.
When it's time to map the product family, the team needs to take a walk around the shop floor. The temptation will be to gather in a meeting room staring at numbers you ran from your MRP system without ever stepping foot onto your shop floor. That's a sure way to miss wasteful activity that the MRP system doesn't report.
Walk through the steps of your value stream where the work is being done. Start at the end of the process, working your way upstream to the beginning, to get a customer-supplier perspective at each step. You will be able to see any waste that's occurring and whether it is unnecessary or acceptable. Don't rationalize waste and assume it is happening only because of a new operator in training or a new product design, as you will miss identifying opportunities for improvement.
As you walk upstream through your value stream, you might be wondering how in the world you are going to collect all the data for each step! It can seem overwhelming for the team. Just remember to keep your team moving, and don't get stuck in "analysis paralysis." Data collection is important, but not at the expense of taking months to get anything implemented.
The first step is to refer to the routings you have available in your MRP system. Conduct time studies where applicable and review the results with the operators. If the operators and your team agree with your results, then use this data to fill in the gaps in your data box for any process that is missing data. Operators can be the best source for information when the data is unavailable and you can't conduct a time study.
Another option is to use data from similar jobs. Referring back to your process quantity routing analysis, you should be able to identify other part numbers in your value stream that are similar. Run a report on a handful of similar parts in your value stream to give you some data to examine.
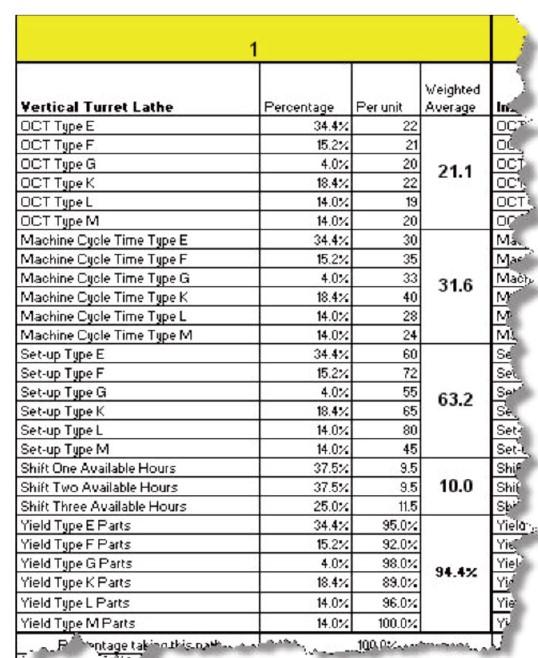
To take into account shared resources, use the weighted average method. Figure 7 shows a calculation procedure for determining the operator cycle time, machine cycle time, setup time, available shift hours, and yield percentage for the vertical turret lathe process.
Value streams E, F, G, K, L, and M are listed for each of the given metrics. The Percentage column shows the percentage you calculated in your product quantity routing analysis listing what percentage of business each value stream represents to your annual gross sales volume. The Per Unit column is the total time it takes to run all of the parts for each value stream through the vertical turret lathe.
In value stream E, the operator cycle time (OCT) is shown as 22 minutes. Listing the total time for each value stream in the Per Unit column allows you to calculate the weighted average time for each metric shown. If you put in the actual data for this formula, the weighted average machine cycle time (MCT) is determined to be 31.6 minutes. This is the average time it takes to get parts through the vertical turret lathe, regardless of which value stream you run through this process.
Remember that when you run parts through a shared resource, the product mix becomes important so that you avoid bottlenecks in your production line.
Metrics and Measurements. On a separate sheet of blank paper, begin constructing your value stream using symbols to indicate what is happening at each process.
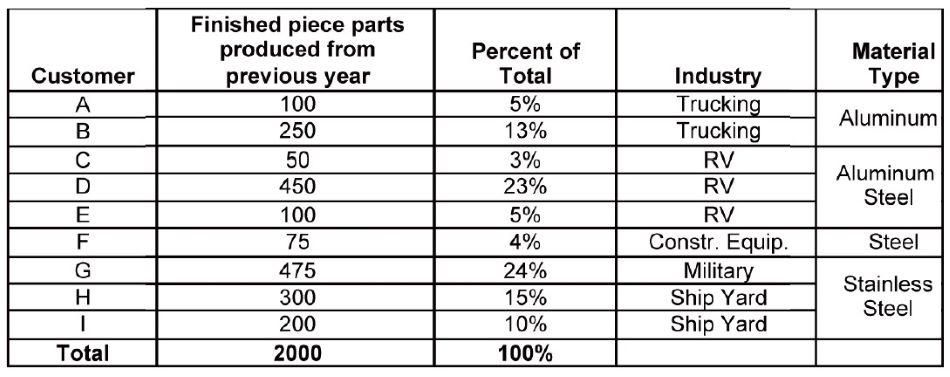
FIGURE 3 By concentrating on the largest product families rather than all of them, you can make your VSM efforts go much more smoothly.
At each step, be sure to measure the appropriate metrics as they apply to your process. This paints a good picture of the current condition at each process, despite what your MRP system says or what others might tell you.
Which metrics should you measure" That depends on your process. The point of VSM isn't data collection; it's to show you where the value is created and where the waste accumulates in your process.
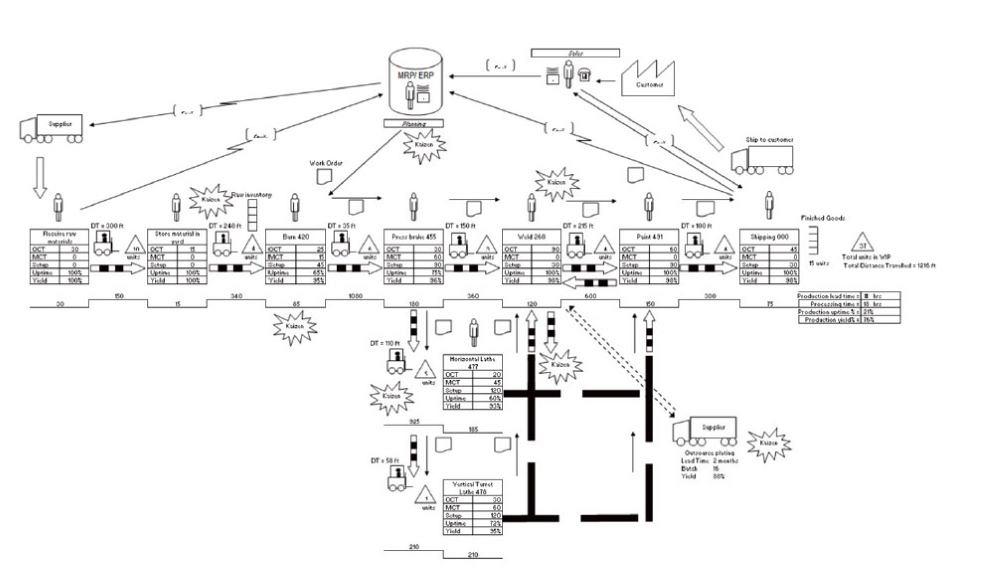
Figure 8 demonstrates an example of a fully constructed VSM from the flow chart in Figure 6.
Points of Outsourcing. On the VSM in Figure 8, a supplier truck symbol identifies where parts are outsourced after welding for plating. This is an important factor you need to include in your VSM. All points of outsourcing in your process, whether because of capacity constraints or lack of necessary equipment, must be identified.
Most problems with outsourcing fall into one of two categories: quality or delivery requirements. The data you gather should include the lead-time, lot size, and yield percentage. Filling in this data for the outsourcing supplier will show you if a kaizen event may be necessary.
Flow of Information. A VSM should show not only the flow of material, but also the flow of information. If you don't know how information flows to the shop floor, you run the risk of processes waiting for instruction, creating downtime. You also have an incomplete picture of what you need to improve without first knowing how the flow of information will support your proposed idea.
For example, let's say you have a weldment that takes 100 hours to complete. You decide that you want to break this into two stages into two different workcells. While it might make sense to break the work out this way, how are you going to know which parts need to be routed to each workcell" How do you know when these parts need to be routed? How will the operators record their time? How will drawings follow the work order (if you use work orders)?
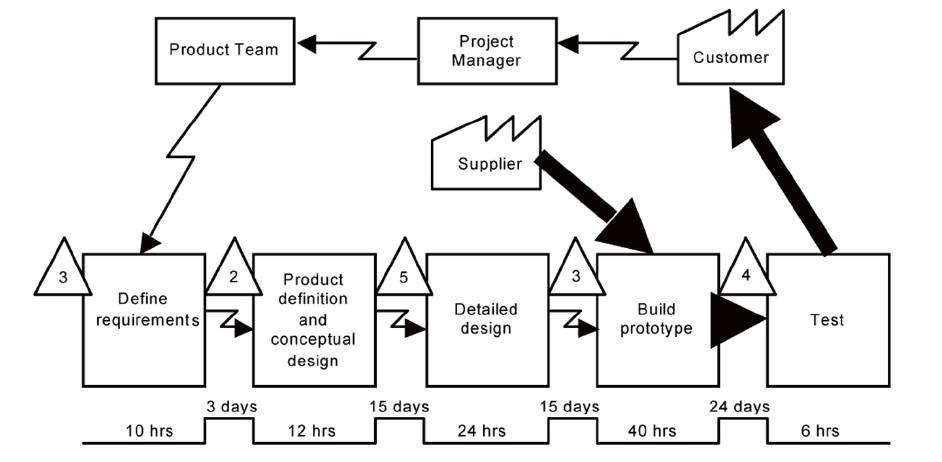
When you start mapping the flow of information, you might discover why your lead-times are so long. Figure 9 is an extended VSM for designing a product in an engineer-to-order environment. While engineering the product takes 11.5 days, the overall lead-time through engineering is 57 days because of the projects in work-in-process (WIP). When a VSM is created for everyone to see, people begin to understand that the problem doesn't lie just in manufacturing alone.
When you have identified all the steps in your value stream and have filled in all the data applicable to your VSM, it's time to put it all together. Figure 8 demonstrates what a sample VSM should like when all the data has been collected. With this format, your team can stand back and look at what the data is telling you about the flow through your process.
Remember, the point isn't to put together an artistic portrait of the flow through your value stream, but to use your VSM to see where the value is being created and identify where wasteful activity occurs. To help you find the waste, examine the process and ask yourself, "If the customer were to walk through each step of this value stream with his checkbook in hand, would he be willing to pay for each step he sees?"
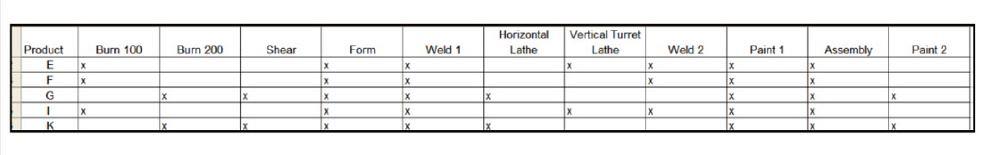
FIGURE 4 Of course, you need to know what parts or products flow through each work center and in what order. This chart helps to determine that.
In addition, looking at your VSM, take the list of kaizen opportunities you identified in this process and begin prioritizing them by level of impact an improvement will make to the flow of your value stream. This will give your team an organized plan of action for where to start making improvements to your value stream.
With your VSM in hand, you are armed, ready, and well on your way to eliminating waste and learning to see the whole picture. Keep in mind that learning to see is not only the first step in creating a lean organization—it is half the battle.


The Fabricator is North America's leading magazine for the metal forming and fabricating industry. The magazine delivers the news, technical articles, and case histories that enable fabricators to do their jobs more efficiently. The Fabricator has served the industry since 1970.
start your free subscription
Easily access valuable industry resources now with full access to the digital edition of The Fabricator.

Easily access valuable industry resources now with full access to the digital edition of The Welder.

Easily access valuable industry resources now with full access to the digital edition of The Tube and Pipe Journal.

Easily access valuable industry resources now with full access to the digital edition of The Fabricator en Español.
In this episode of The Fabricator Podcast, Caleb Chamberlain, co-founder and CEO of OSH Cut, discusses his company’s...


