President
- FMA
- The Fabricator
- FABTECH
- Canadian Metalworking
Categories
- Additive Manufacturing
- Aluminum Welding
- Arc Welding
- Assembly and Joining
- Automation and Robotics
- Bending and Forming
- Consumables
- Cutting and Weld Prep
- Electric Vehicles
- En Español
- Finishing
- Hydroforming
- Laser Cutting
- Laser Welding
- Machining
- Manufacturing Software
- Materials Handling
- Metals/Materials
- Oxyfuel Cutting
- Plasma Cutting
- Power Tools
- Punching and Other Holemaking
- Roll Forming
- Safety
- Sawing
- Shearing
- Shop Management
- Testing and Measuring
- Tube and Pipe Fabrication
- Tube and Pipe Production
- Waterjet Cutting
Industry Directory
Webcasts
Podcasts
FAB 40
Advertise
Subscribe
Account Login
Search
Sales and operations planning meets contract fabrication
How good people, information, and communication build a competitive business
- By Dan Marino
- October 16, 2014
- Article
- Shop Management
Departments that operate in isolated silos rarely interact. This plants the seed for trouble, and the problems start in planning. In a typical company, every year top executives, with the help of financial managers, develop a revenue plan that details sales goals month by month. The numbers often come from market research and talking with top sales managers, but some of the numbers also come from the wishes of senior management.
Senior managers then send the revenue plan to top managers throughout the company, including those in finance, sales, and production. Quite often this is the first time people in production have seen the revenue plan. They may have the capacity to meet it, but only if orders come in at the right time; in the real world, they usually don’t. Alternatively, manufacturing might not have the needed capacity at all. At the same time, the sales team may see the plan and notice it doesn’t jive at all with what they’re hearing from customers and prospects.
Planning like this, with each stakeholder in isolation, sets the wheels of inefficiency in motion. A company can improve operations, reduce inventory, implement 5S, but bad planning can hinder all of these efforts, and this is where sales and operations planning, or S&OP, comes into play. The method challenges decision-making with limited information by a few managers. It offers a framework for communication among all departments: sales, marketing, finance, purchasing, and manufacturing.
The revenue plan has always been a living document, altered as needed to adapt to changing business conditions.
But under S&OP, the revenue plan doesn’t just come in as marching orders from on high; instead, the revenue plan becomes collaborative.
Some Background
The origins of S&OP go back to the 1980s. Oliver Wright, a pioneer in innovative operations and planning, generally is given credit for designing and promoting S&OP, which involves balancing supply and demand, analyzing volume and customer mix requirements, and comparing these requirements to an ideal asset management plan. It helps executives define and manage risk and involves a range of company activities, requiring input from marketing, manufacturing, sales, supply chain management, and finance.
S&OP requires sales managers to develop a sales forecast. It also requires accurate and current data from a company’s operating system, be it an enterprise resource planning (ERP) system or otherwise. Managers then can use this information to develop capacity plans that help steer decisions for additional capital equipment, manpower, facility expansions, and more.
S&OP should involve key managers from all areas of the company. The exact process varies depending on the company, but the fundamental component is a repeating sequence of collaboration, agreement on a plan, plan updates, feedback, and corrections. For a manufacturer, the process might be as follows:
- Data gathering, including capacity utilization, past sales, and how much actual sales deviated from the forecast.
- Sales forecast for existing and new products.
- Demand review: Does the sales forecast match expected market demand?
- Plant operations review: Does the plant floor have capacity to meet the forecast sales?
- Reconciliation: Leaders reconcile differences in the plan from all departments.
This monthly exercise looks not at tomorrow, next week, or next month, but 12 to 18 months into the future. Sure, it can be easier to forecast demand two months down the road, but the forecast isn’t very useful, because it doesn’t give the company enough time to adapt available capacity to match expected demand, be it hire more people, add more machines, or any other operational change.
In one sense, S&OP puts senior management in the control tower, giving them access to the right information to make critical decisions on the direction of the company and its ability to sustain consistent, profitable growth.
Adapting S&OP to Contract Fabrication
The first step in S&OP involves gathering data, and this includes forecasting both sales volume as well as capacity utilization on the floor. Both can be challenging, especially when it comes to contract manufacturing. How can a company that makes thousands of different parts for hundreds of different customers from different sectors possibly forecast sales to any useful degree of accuracy?
It just so happens that one of the country’s largest contract fabricators, O’Neal Manufacturing Services (OMS), has developed such a forecasting method, even though the company makes myriad parts for different customers. It used S&OP as a framework to make it happen.
With more than 3,500 employees, O’Neal Industries represents the country’s largest family-owned group of metal service centers, and its OMS subsidiary serves as the company’s contract manufacturing provider, offering cutting, bending, welding, postweld machining, and comprehensive assembly services at plants located across the country.
OMS supplies fabricated metal components and welded assemblies to FORTUNE® 1000 companies. Its customers build equipment and manage projects that shape the world we live in—locomotives, fork trucks, bulldozers, power generation, and more.
Know that the typical situation that began this article doesn’t apply to OMS. The company already had the right culture in place for S&OP, and senior managers bought into the concept almost immediately.
S&OP requires a culture that promotes good decision-making that isn’t overly pessimistic or optimistic, but instead based on good data. It boils down to a simple concept: Good decisions require good information and good communication.
OMS’s journey began with a simple question from the vice president of operations: How can I see resource requirements for a six- to 12-month time horizon? To find an answer, a cross-functional team worked for close to a year, documenting current processes and researching best practices.
The S&OP project at OMS officially started in August 2013. A pilot program launched at one plant in November, and by April 2014 eight OMS plants had implemented the process.
Good Data and the Right People
Good information is difficult enough for an OEM to obtain, but what about an organization like OMS, with thousands of different products made for different OEMs in different industries? How do you tackle a sales forecast for a company like this?
The OMS team began by identifying product families related to specific sectors, even correlating product families to specific NAICS codes. They identified distinct “demand streams” that related to specific industries as well as new-product launches. Looking at the mountain of data, however, they realized that this approach was just too cumbersome to be effective.
Then one sales manager walked into a meeting with an idea grounded on the 80/20 principle: Although the company processes more than 7,000 part numbers, the majority of its revenue comes from 300 repeatedly ordered parts. What if the company used these key products as the foundation for the forecast?
To that end, the team developed a forecasting method that looked out 18 months for those key parts. They compared past forecasts to actual sales, analyzed market data, and drew from customer-provided forecasts and other planning documents. They then used a disaggregation process that, basically speaking, applied the forecast data from those 300 key items to the remaining parts for which OMS needed to forecast demand.
They then identified 15 critical resource groups—including plate cutting, bending, machining, welding, and final assembly—and factored in bills of material and routings, all based on the forecast for those top 300 products. The goal was to provide a consolidated view of machines and processes to develop a correlating 18-month supply plan and identify any capacity constraints.
They also considered supply chain constraints, including raw stock, purchased components, and outsourced processes.
All this gave the team the basic building blocks for S&OP, which at OMS is conducted via an eight-step repeating process:- Data gathering
- Sales forecasts for new products
- Sales forecasts for existing products
- Demand review
- Plant operations review
- Consolidated operations review (including supply chain constraints)
- Preliminary S&OP reconciliation
- Executive S&OP meeting, when reconciliation is finalized
The company also hired an S&OP coordinator to ensure the right communication and meetings took place every month. S&OP information, stored in custom software, is also being tied directly to OMS’s ERP system.
At this writing, the fabricator is starting to tie the S&OP plan directly to its master production schedule for each plant, where each scheduler can see a two-month projection of capacity requirements and how they compare to available capacity.
As the plan changes, the scheduler can see where potential bottlenecks might occur—plate cutting, machining, welding, and so forth—and make appropriate adjustments. In short, using the information from S&OP, the scheduler can predict and prevent bottlenecks.
Critical Elements for Success
The journey at OMS has just begun. Even though S&OP has reached all areas of the organization, the fabricator still is in the early stage. Just like any other process, S&OP is subject to continuous improvement.
The fabricator hopes to further integrate S&OP information with its master production scheduling, as well as with new-product launches. For instance, it plans to use S&OP to help start material requirement planning earlier in product launch programs.
To make S&OP really work requires a truthful perspective, both of internal manufacturing operations and external customer demand. It needs an accurate picture of available capacity, which is why OMS installed Shoplogix (www.shoplogix.com), software that tracks actual machine uptime and availability.
If actual operations take longer than people think they do—be it because of extensive setup time, miscommunication, material unavailability, a delayed outsourced process, or anything else—troubles arise. If parameters for available capacity are inaccurate, any plan for the future will be inaccurate too.
S&OP also requires people to realize the need for flexibility, including the importance of excess capacity. No forecast in the world is 100 percent accurate, and the best planning won’t prevent a major customer from calling up the fabricator with an unexpected hot job. To handle the unexpected in a timely manner, with minimal use of overtime, the company needs to ensure it has excess capacity at critical processes, be it in the front office or on the shop floor.
An Adaptable Process
S&OP is working wonders at OMS. The forecasts built last year on those 300 core parts have turned out to be extremely close to actual sales figures.
But just because OMS is large doesn’t mean S&OP can’t be scaled down to smaller operations. At its core, S&OP is simple and rational. It’s a continuous cycle involving good people from all areas of the organization, accessing good data, communicating honestly, and collaborating to develop the best plan for the future.
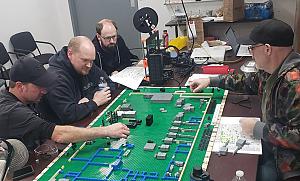
Plant floor images courtesy of O’Neal Manufacturing Services, 744 41st St. N., Birmingham, AL 35222, 877-623-3344, www.onealmfgservices.com.
About the Author
Dan Marino
110 Greenwood Lane East
Windsor, CT 06088
860-623-2521
subscribe now
The Fabricator is North America's leading magazine for the metal forming and fabricating industry. The magazine delivers the news, technical articles, and case histories that enable fabricators to do their jobs more efficiently. The Fabricator has served the industry since 1970.
start your free subscription- Stay connected from anywhere
Easily access valuable industry resources now with full access to the digital edition of The Fabricator.

Easily access valuable industry resources now with full access to the digital edition of The Welder.
Easily access valuable industry resources now with full access to the digital edition of The Tube and Pipe Journal.
- Podcasting
- Podcast:
- The Fabricator Podcast
- Published:
- 04/16/2024
- Running Time:
- 63:29
In this episode of The Fabricator Podcast, Caleb Chamberlain, co-founder and CEO of OSH Cut, discusses his company’s...
- Trending Articles
How to set a press brake backgauge manually

Capturing, recording equipment inspection data for FMEA

Tips for creating sheet metal tubes with perforations
Are two heads better than one in fiber laser cutting?

Hypertherm Associates implements Rapyuta Robotics AMRs in warehouse

- Industry Events
16th Annual Safety Conference
- April 30 - May 1, 2024
- Elgin,
Pipe and Tube Conference
- May 21 - 22, 2024
- Omaha, NE
World-Class Roll Forming Workshop
- June 5 - 6, 2024
- Louisville, KY
Advanced Laser Application Workshop
- June 25 - 27, 2024
- Novi, MI

