


Graduate Research Associate - Center for Precision Forming

Finite element (FE)-based computer software commonly is used in the sheet metal forming and stamping industry for die design and for predicting metal flow and thinning in the formed part. It is a useful tool for predicting and preventing forming defects such as fracture and wrinkling.
However, to obtain reliable results from simulations, you must have reasonably accurate input data on the sheet material’s properties, such as its E-modulus, flow stress (true stress/true strain) curve, and an average value of the coefficient of friction.
The most commonly used test to obtain the mechanical properties of sheet materials is the tensile test. The engineering stress/strain curve can be modified, by using appropriate equations, to a true stress/true strain or flow stress curve.
In the industry, it is common to use only the E-modulus, yield strength (YS), ultimate tensile strength (UTS), and total elongation (ET), obtained from the tensile test, as the sheet’s mechanical properties. However, tensile test data must be modified using Hollomon’s equation to generate the flow stress (σ/ϵ) curve in an exponential form:

Tensile and bulge tests are the two most commonly used tests for determining material properties. In the tensile test, material undergoes uniaxial strain; the test can provide the flow stress data only up to small strain values compared to the biaxial bulge test. That’s why the flow stress data needs to be extrapolated to higher strain values using Equation 1. The extrapolated curve might not represent the hardening behavior of the material accurately and therefore can reduce the accuracy of the simulation results.
Using flow stress data obtained from the bulge test is recommended since this test can provide the hardening curve up to the higher strain values, reducing the risk of error from extrapolating the data. However, running a bulge test to obtain the flow stress data requires special tools and equipment, so most people prefer to use the simple tensile test and extrapolate the data using Hollomon’s equation.
Researchers at The Ohio State University’s Center for Precision Forming (CPF) conducted a study to investigate how the use of flow stress data obtained from a bulge test instead of a tensile test affects simulation results. To CPF’s best knowledge, there is no study that shows this effect. This study shows only the difference in simulation results. Since the experimental data is not yet available, the researchers cannot conclude which test (tensile or bulge) can provide more accurate prediction.
In the study, researchers simulated the deep drawing of a nonsymmetrical part. All simulations were conducted using PAMSTAMP® software. The die set, shown in Figure 1, was designed at CPF and built by Shiloh industries Inc.
Two different advanced high-strength steels (AHSS)—DP980 (1.2 mm) and DP590 (1.3 mm)—were considered for this study. The bulge tests were conducted at EWI, and the tensile tests were conducted at Honda R&D.
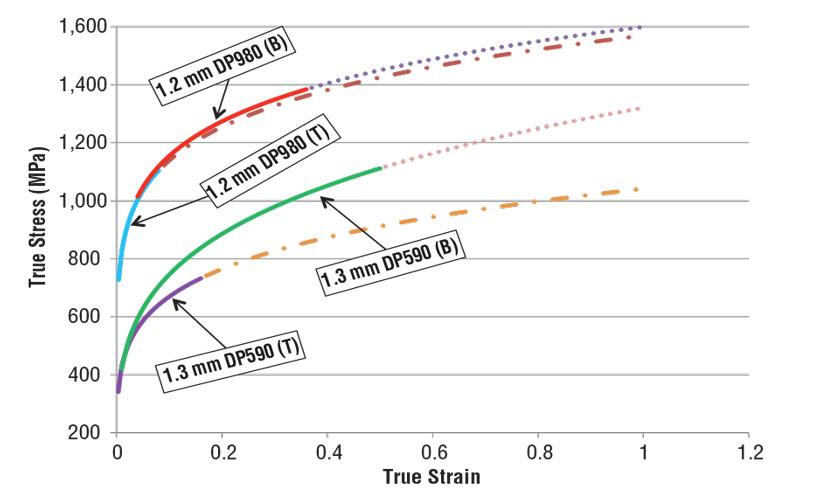
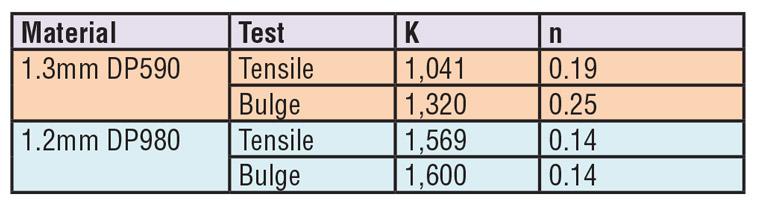
The flow stress data obtained from both tests is shown in Figure 2. All curves were extrapolated to true strain = 1 using Equation 1. The calculated K and n values are summarized in Figure 3. As shown in Figure 2, the flow stress data obtained from the bulge test and the tensile test is different for 1.3-mm DP590 but almost the same for 1.2-mm DP980. The difference between tensile and bulge test data depends on material. For some materials, the bulge test and the tensile test can provide similar flow stress curves while the test results can be different for some other materials.
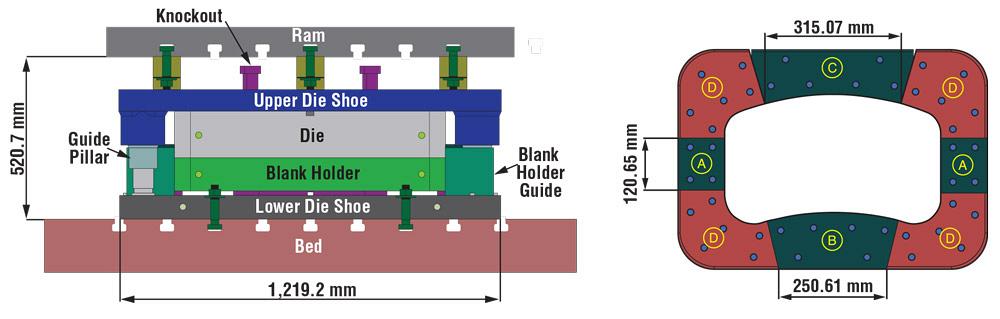
Figure 1
Shown here are the dimensions of the die set used in the CPF study.
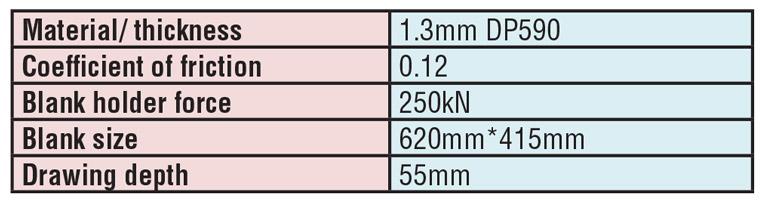
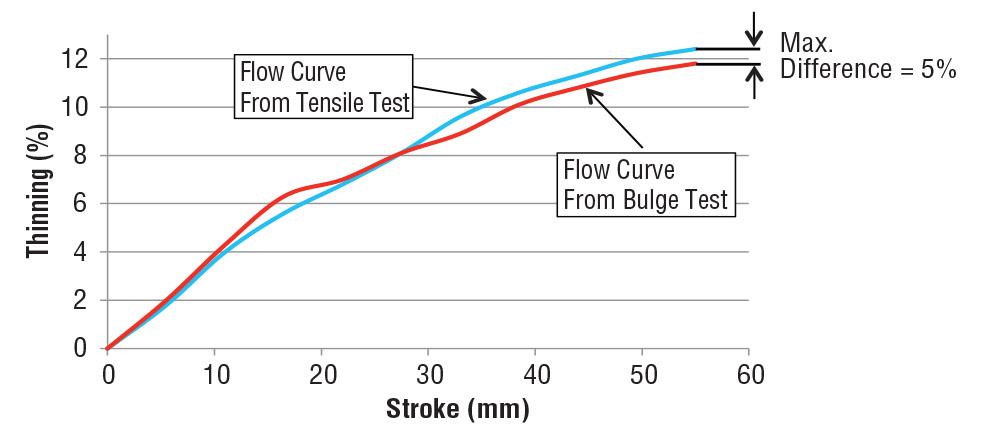
Since the curves obtained for 1.2-mm DP980 are the same from the tensile test and the bulge test, this material was not considered for the simulation in this study; simulations were conducted only for 1.3-mm DP590. The sheet was drawn up to 60-mm punch stroke. Figure 4 shows the simulation inputs. The thinning rate and stroke are compared in Figure 5.
As shown in Figure 5, different flow stress data affects the simulation results in terms of prediction of maximum thinning and forming load. The predicted maximum thinning obtained when the flow stress data from the tensile test was used was 5 percent lower than when the flow stress curve from the bulge test was used.
Also, the prediction of the load showed a maximum difference of 11 percent. Results showed that the difference between the flow curves affected the prediction of both thinning and forming load.
In the future, CPF will conduct a study to consider the effect of the different flow stress data on prediction of parameters that this study did not consider, including strains, failure based on FLC, and springback. This study will allow researchers to determine whether or not extrapolating the tensile data can significantly reduce the accuracy of the simulation results. Moreover, a comparison between experimental results and simulation will provide better understanding as to which testing method (the tensile test or the bulge test) can provide more accurate flow stress data and thus more accurate simulation results.
References
N. Kardes, C. Choi, X. Yang, and T. Altan, “Determining the flow stress curve with yield and ultimate tensile strengths, Part I,” STAMPING Journal, May/June 2011, pp. 12-13.
N. Kardes et al, “Determining the flow stress curve with yield and ultimate tensile strengths, Part II,” STAMPING Journal, July/August 2011, pp. 14-15.
A. Fallahiarezoodar and T. Altan, “Determining flow stress data by combining uniaxial tensile and biaxial bulge tests,” STAMPING Journal, September/October 2015, pp. 16-17.

Professor Emeritus and Director - Center for Precision Forming

The Fabricator is North America's leading magazine for the metal forming and fabricating industry. The magazine delivers the news, technical articles, and case histories that enable fabricators to do their jobs more efficiently. The Fabricator has served the industry since 1970.
start your free subscription
Easily access valuable industry resources now with full access to the digital edition of The Fabricator.

Easily access valuable industry resources now with full access to the digital edition of The Welder.

Easily access valuable industry resources now with full access to the digital edition of The Tube and Pipe Journal.

Easily access valuable industry resources now with full access to the digital edition of The Fabricator en Español.
In this episode of The Fabricator Podcast, Caleb Chamberlain, co-founder and CEO of OSH Cut, discusses his company’s...


