Professor Emeritus and Director - Center for Precision Forming

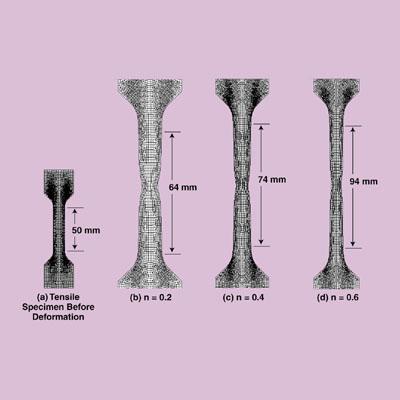 |
| Figure 1: Magnitudes of elongation at the onset of necking vary with the n value. |
Editor's Note: This column was prepared by the staff of the Engineering Research Center for Net Shape Manufacturing (ERC/ NSM), The Ohio State University, Professor Taylan Altan, director.
Strain hardening is represented by the exponent n in the flow stress equation s¯ = Ke¯n, which approximates the relation between true stress, s¯, and true strain, e¯, during plastic deformation of a metal.
The constant n plays a crucial role in sheet metal forming. The larger the n value, the more the material can elongate before necking. Thus, as the n value increases, the material's resistance to necking increases, and the material can be stretched farther before necking starts.
The effect of the n value in deep drawing is ambiguous. In cup drawing, for example, higher n values may reduce wrinkling; a high n value results in higher strain hardening in the cup wall, so the material does not fracture easily when the blank holder force is increased. On the other hand, with increased strain hardening, the drawing force and the stress in the cup wall also increase, which may lead to fracture.
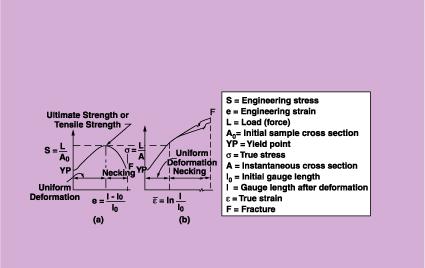 |
| Figure 2: Data from a tensile test is represented in (a) an engineering stress-strain curve and (b) a true stress-strain curve.1 |
The n value can be obtained by conducting a simple tensile test in which the specimen is stretched until it fractures (seeFigure 1a). In practice, however, the onset of necking is considered to be the maximum deformation limit.
In tensile testing, tensile load is recorded as a function of the increase in gauge length. When load-elongation data is converted to engineering stress and strain, a curve as in Figure 2acan be plotted. If the results of tensile testing are to be used to predict how a metal will behave under other forms of loading, the data should be plotted in terms of true stress and true strain (see Figure 2b). The n value then can be obtained by calculating the slope of the true stress and true strain curve.
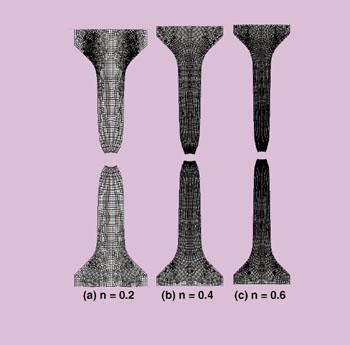 |
| Figure 3: Fracture also can be predicted by FEM simulation |
The effect of the n value on deformation in a tensile test was investigated with the finite element method (FEM) simulation using the FEM software DEFORM2D. Standard tensile testing procedure and specimen dimensions were used as prescribed in American Society for Testing and Materials (ASTM) E8.
It is well-known that increasing the n value also increases the formability of the material. The purpose of this investigation was to illustrate this phenomenon by using FEM simulation. The specimen geometry was provided by a mesh, which is similar to circle grids on sheet metal.
The gauge lengths for n values of 0.2, 0.4, and 0.6 were measured after deformation (see Figures 1b, 1c, 1d). The initial gauge length was 50 millimeters before deformation; for the n values of 0.2, 0.4, and 0.6, stretched lengths of 64 mm, 74 mm, and 94 mm were obtained, respectively, at the onset of necking.
Figure 1 also illustrates the difference in mesh deformation between the undeformed and deformed specimens in the FEM simulation. Fracture also can be predicted by FEM simulation using the appropriate fracture criterion. Figure 3shows the fractured specimens for each n value. It is also quite obvious that materials with higher n values elongate more before fracture takes place.
1. T. Altan, Metal Forming: Fundamentals and Applications (Metals Park, Ohio: American Society for Metals, 1985), p. 46.ASTM, 100 Barr Harbor Drive, West Conshohocken, PA 19428-2959, phone 610-832-9585, fax 610-832-9555, e-mail service@astm.org, Web site: www.astm.org.

Professor Emeritus and Director - Center for Precision Forming


The Fabricator is North America's leading magazine for the metal forming and fabricating industry. The magazine delivers the news, technical articles, and case histories that enable fabricators to do their jobs more efficiently. The Fabricator has served the industry since 1970.
start your free subscription
Easily access valuable industry resources now with full access to the digital edition of The Fabricator.

Easily access valuable industry resources now with full access to the digital edition of The Welder.

Easily access valuable industry resources now with full access to the digital edition of The Tube and Pipe Journal.

Easily access valuable industry resources now with full access to the digital edition of The Fabricator en Español.
In this episode of The Fabricator Podcast, Caleb Chamberlain, co-founder and CEO of OSH Cut, discusses his company’s...