


President
Just because the sheet metal looks good doesn't mean that it is going to perform as expected.
The sheet metal supplier says nothing’s changed with the metal. The stamper says nothing’s changed with the process. But something must have changed, because the part is now splitting!
Yes, something is different. It’s just not being measured.
Supplier Versus StamperA relatively complex part was being stamped from galvanized high-strength steel. For a little more than a year, the scrap rate remained consistent at 1 percent, or 40 split parts out of 4,000 stamped per month. Over a three-month period, though, problems increased dramatically, and the new scrap rate was 375 split parts out of 4,000—almost 10 percent.
The sheet metal supplier and stamper went back and forth, blaming each other for the additional scrap and disagreeing on the chargeback amount. A review of the material certs from the steel company showed that base metal chemistry was consistent and satisfied the OEM specification.
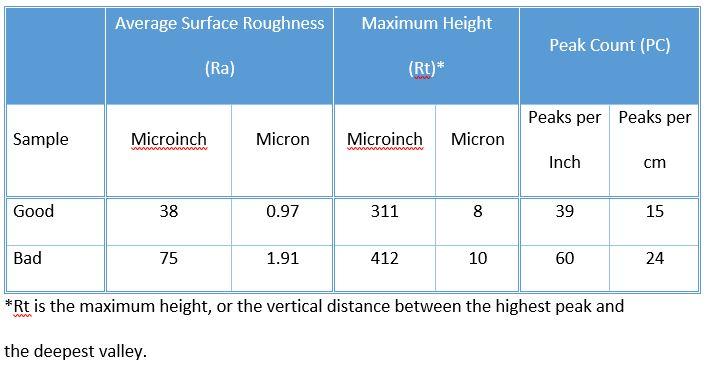
The stamper kept detailed records of performance by coil. A random sampling showed that there were no significant differences in yield strength, tensile strength, and elongation. A few of the certified mill properties included data on average surface roughness. Here, the values appeared to be in the normal range, and the values from the good and bad coils overlapped (see Figure 1).
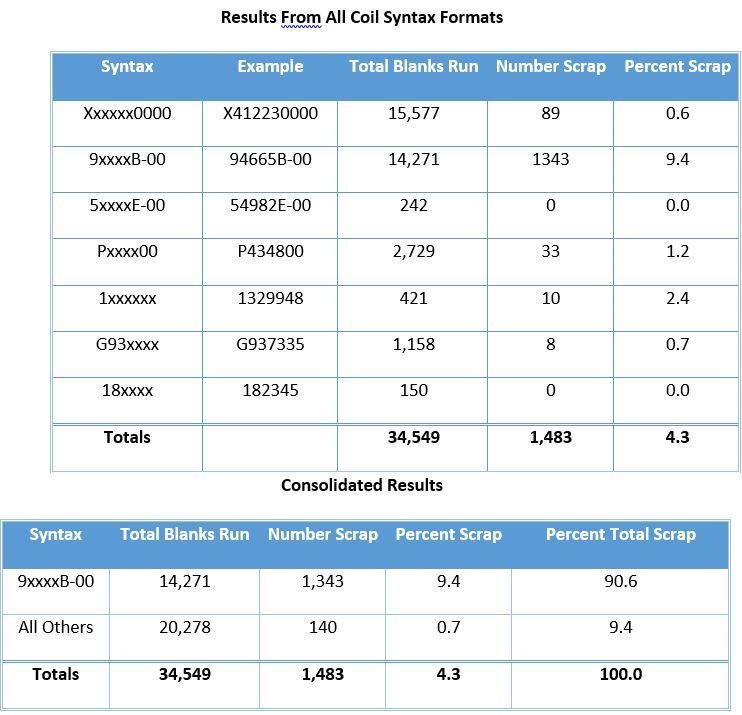
But a review of the certs showed something that raised concern. Usually, when coils come off a steel mill unit, such as a galvanizing line, they are numbered sequentially but otherwise look similar. However, the coil numbers in this instance were in many different formats, with more than 90 percent of the scrap associated with one particular syntax format (see Figure 2).
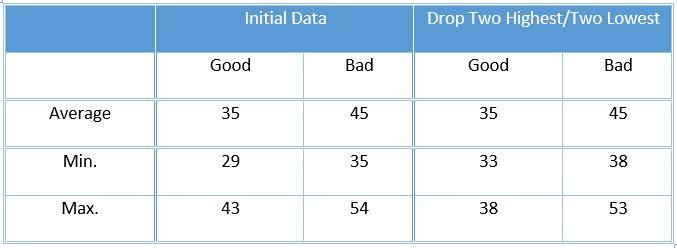
These observations helped focus the troubleshooting. Nothing stood out with the strength and elongation results, but the roughness results warranted a closer look. To remove the influence of any outliers, the two highest and two lowest values in each category were dropped. This led to two distinct populations, as shown in Figure 3. Since these values are still considered normal for this product, they were not enough evidence to conclusively attribute the problems to the roughness differences.
Measuring the Sheet Metal SurfaceThe two most common ways to describe the surface of sheet metal are average surface roughness (Ra) and peak count (PC). Ra can be thought of as the height of the trees in a forest, while PC is the number of trees in the forest. Changes in Ra and PC affect the interaction of the sheet steel with the lubricant and the tooling surface, which in turn changes friction and affects formability.
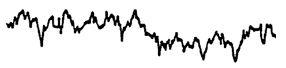
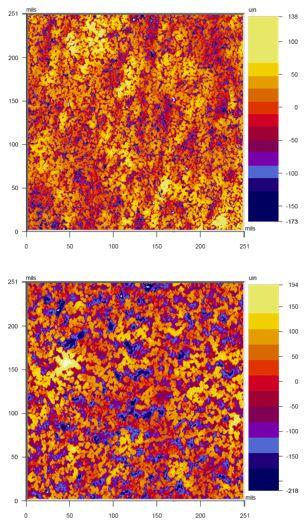
Selected samples were tested using a conventional stylus profilometer and a technique called optical surface profilometry (OSP). With the first technique, the stylus is moved across the surface of the steel, and a 2-D profile (length of steel sample and height of peaks/valleys) is recorded and analyzed (see Figure 4). With this method, the stylus’s diameter might cause the depth of some valleys to be missed, and the stylus’s weight can depress peaks in the soft zinc coating, influencing results. The second technique, OSP, is a noncontact approach that provides a 3-D picture of the surface (see Figure 5).
Although these values are indicative of different surfaces, the data and pictures of ¼- by ¼-in. areas show that the split sample has a higher average roughness, more extreme peak-to-valley differences, a greater number of peaks in a given length, and a greater number of larger isolated valleys (see Figure 6). These surface parameter differences translate into different frictional characteristics between the sheet steel and the tooling surfaces, which affects formability. The magnitude of the differences reasonably accounts for the increase in scrap rate from 1 to almost 10 percent.
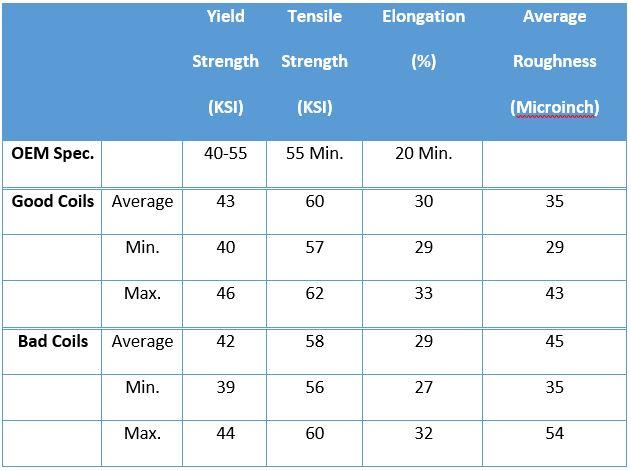
Figure 1. A random sampling showed that there were no significant differences in yield strength, tensile strength, and elongation. The average surface roughness appeared to be in the normal range, and the values from the good and bad coils overlapped.
Because of production capacity and unit loading conditions, the steel supplier had decided to produce this product on two different galvanizing lines. Since the lines had the same features and characteristics, the supplier assumed this would be an insignificant process change and therefore didn’t report it to the stamper. The steel supplier routinely measured and reported yield strength, tensile strength, and elongation on every coil, and no differences were found between coils produced on either galvanizing line.
After the stamper presented the steel supplier with the data, the supplier admitted the process change. Production was restricted to the initial galvanizing line once again, and the scrap rate returned to 1 percent. While the offending feature of the other galvanizing line was never disclosed, it could have been related to the inline temper pass following galvanizing, which would have affected the resulting surface.


The Fabricator is North America's leading magazine for the metal forming and fabricating industry. The magazine delivers the news, technical articles, and case histories that enable fabricators to do their jobs more efficiently. The Fabricator has served the industry since 1970.
start your free subscription
Easily access valuable industry resources now with full access to the digital edition of The Fabricator.

Easily access valuable industry resources now with full access to the digital edition of The Welder.

Easily access valuable industry resources now with full access to the digital edition of The Tube and Pipe Journal.

Easily access valuable industry resources now with full access to the digital edition of The Fabricator en Español.
In this episode of The Fabricator Podcast, Caleb Chamberlain, co-founder and CEO of OSH Cut, discusses his company’s...


