


Consultant
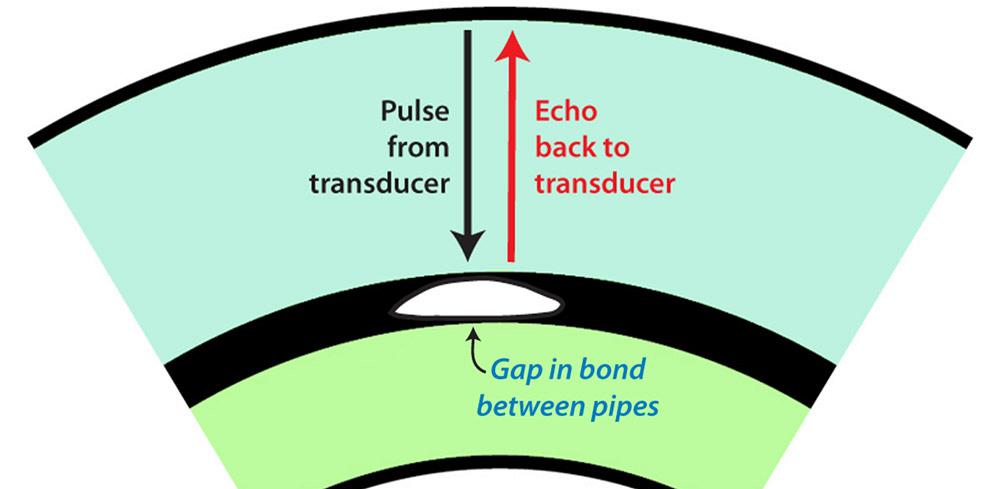
Figure 1
An ultrasonic wave travels through two tube or pipe walls and the bond interface with little trouble. Where the pulse meets a gap, which
normally is full of air, the solid-to-gas boundary causes a very high-amplitude echo, which is interpreted as a flaw.
For the past few decades, acoustic microimaging (AMI) tools have proven useful in finding and mapping features in the bond zone between a small-diameter tube or pipe and the large-diameter tube or pipe into which it has been inserted and bonded. The purpose is usually to look for gap-type defects, such as voids, delaminations, and nonbonded areas, between the small tube’s ID and the large tube’s OD (see Figure 1). This application is a nondestructive method that finds types of structural anomalies, meaning that no cutting or grinding processes are necessary.
A new technology makes it possible for an acoustic microimaging tool to map the ID of a single tube or pipe. The resulting acoustic image is a contour map of the ID surface that reveals large-area changes in contour as well as local imperfections. For example, the contour map can tell how well suited the tube or pipe is for applications such as bonding in which the condition of the ID surface is critical, or for high-pressure applications in which the local wall thickness is important.
Wall thickness can be measured at specific locations by using conventional ultrasound probes, which can be used in the field and do not require the tube or pipe to be fixtured. The advantage of the new technology is that it creates an image of the entire ID surface at thousands or millions of X-Y coordinate points and uses the data to make a map of the ID surface. The spatial resolution is also higher than that of ultrasound probes.
A tube-in-tube or pipe-in-pipe sample is mounted horizontally on an AMI tool in a fixture that rotates the sample slightly after each scan of the workpiece’s length. Scanning in an AMI tool is performed by a transducer that transmits an ultrasound signal into the sample and receives the echoes.
When the pulse reaches the smaller tube’s ID, it again reaches a solid-to-gas interface. At this point the signal is somewhat diminished, and as before nearly 100 percent of this smaller signal is reflected. The transducer carries out this transmit-and-receive function thousands of times per second as it travels the length of the pipe.
Painting, powder coating, galvanizing, and other surface treatments add a new layer of material. Very thin layers might not have any effect on the acoustic properties of the tube. However, paints are polymers, because they generally are porous, may absorb water. If a region of the paint becomes delaminated from the tube, the gap will produce a very high-amplitude echo.
New technology now carries the role of the AMI tool a step further: It can map a single tube or pipe’s ID (see Figure 2). In situations where there is concern that the ID might be damaged from processing or from another cause, or in a case in which the wall thickness must be uniform throughout, the AMI tool can generate a color map that shows all variations in wall thickness over the entire ID. The variations might be sharp dings in the ID or slight variations over a relatively large area.
When used on plate or other flat steel products, the transducer moves laterally across the sample’s width, moves forward, and then moves back across the width. The same thing is accomplished when a hollow sample is mounted to a rotary fixture. The transducer moves down the length of the pipe, the fixture rotates the sample, and the transducer moves back down the length of the pipe. When the pipe has rotated through slightly more than 360 degrees, the data collection phase is complete and the software is ready to create an acoustic image of the workpiece.
To map the ID of a tube or pipe, the transducer launches a pulse of ultrasound into the sample, just as it does for reflection-mode imaging. However, ID mapping uses a different process. Rather than recording the amplitude of the echoes, the transducer records their time of flight. It is concerned with echoes from only two sources, or interfaces (see Figure 2). Both of these are interfaces between a solid and a nonsolid, but the transducer is concerned only with the difference between the arrival times of the two echoes, and not with their amplitude. Knowing the time it takes an echo to arrive at the transducer from each of the thousands or millions of launch points provides the data for mapping the ID.
Software uses the acoustic velocity of the material to convert the arrival time into distance to measure the depth of both interfaces. The arrival times are reported in nanoseconds. Ultrasound travels through copper, for example, at about 15,420 feet per second (4,700 meters per second). In 1 nanosecond, it travels 0.000185 in. (4.7µ). The contour measurements of the ID surface are therefore very precise.
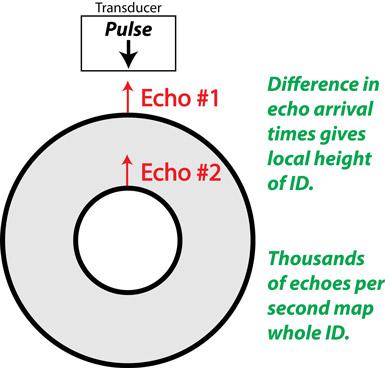
Figure 2
For ID mapping, the transducer records the time it takes the sound waves to travel through
the material and return. Echo 1 is caused by the liquid-to-solid interface; echo 2 is caused
by the solid-to-air interface. The difference in arrival times is used to calculate the wall
thickness.
The first echo, from the water-to-OD interface, is used as the reference number; the distance in time of the second echo from this reference is used to calculate the distance to the ID of the pipe. The difference is the wall thickness.
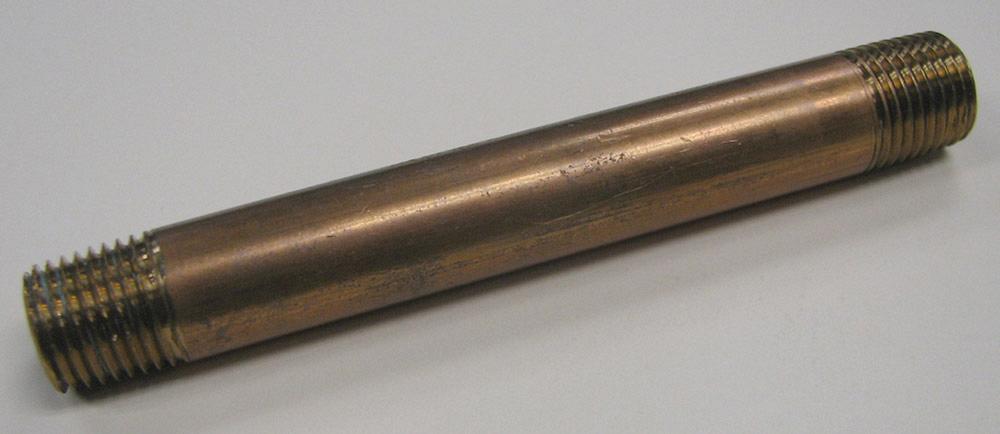
The ID surface of the length of copper alloy pipe shown in Figure 3 was mapped. The transducer scanned the nonthreaded length of the pipe; the pipe was then turned slightly, and the transducer scanned back along the pipe. This sequence was followed until the entire circumference had been scanned. See Figure 4.
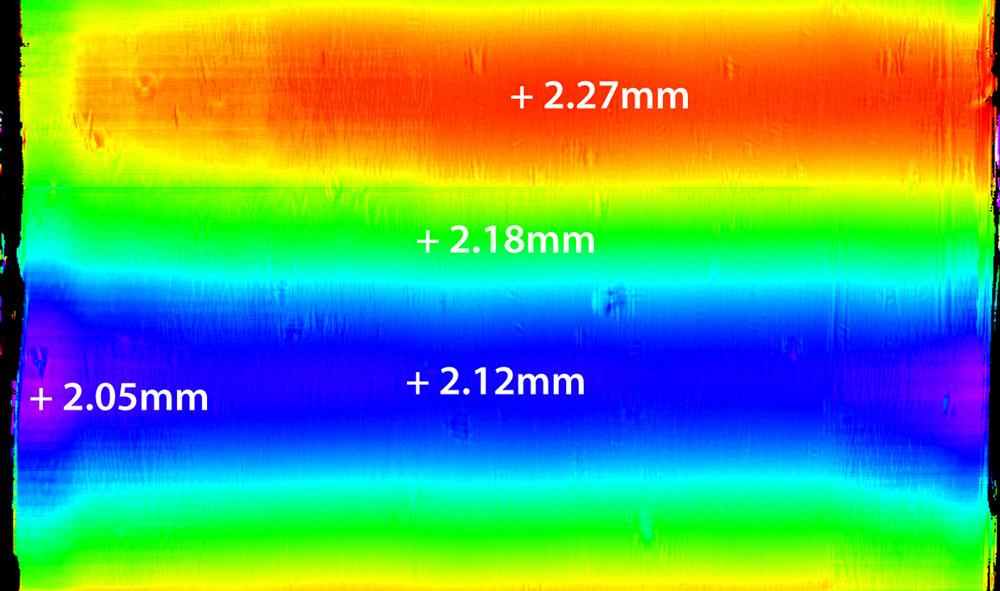
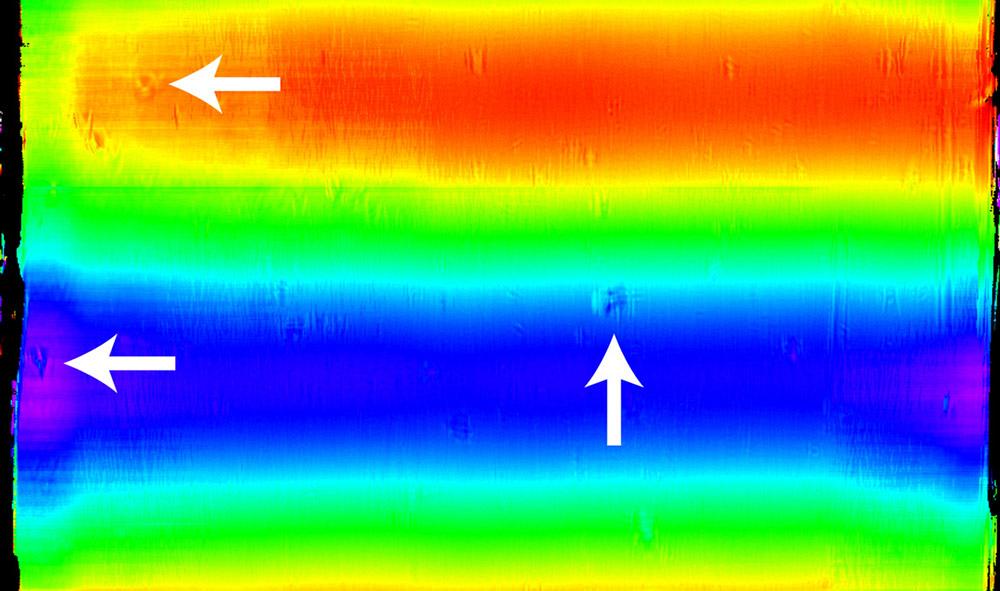
Red indicates the longest echo delay, whereas purple indicates the shortest echo delay. The color difference means that the ID is not concentric with the OD, and this is consistent along nearly the entire length of the pipe. It is worth noting that the thickest value, 2.27 mm, is more than 10 percent greater than the thinnest value, 2.05 mm. Although an end view of the tube’s OD might be circular, the ID is much less regular.
Note the yellow band at the bottom of Figure 4. If it were placed along the top edge of the image, the yellow bands would overlap. Standard practice is to rotate the sample through slightly more than 360 degrees to demonstrate that the image captures the entire circumference. A color map was chosen that would avoid sharp changes in boundaries over short distances.
Sudden color changes indicate sudden changes in wall thickness. Three arrows point out surface pits on the ID, visible because they display sudden local variations in the echo arrival time and therefore in the distance (see Figure 5). Several other irregularities not marked by arrows are present in this image.


The Tube and Pipe Journal became the first magazine dedicated to serving the metal tube and pipe industry in 1990. Today, it remains the only North American publication devoted to this industry, and it has become the most trusted source of information for tube and pipe professionals.
start your free subscription
Easily access valuable industry resources now with full access to the digital edition of The Fabricator.

Easily access valuable industry resources now with full access to the digital edition of The Welder.

Easily access valuable industry resources now with full access to the digital edition of The Tube and Pipe Journal.

Easily access valuable industry resources now with full access to the digital edition of The Fabricator en Español.
In this episode of The Fabricator Podcast, Caleb Chamberlain, co-founder and CEO of OSH Cut, discusses his company’s...


