


Tube Rolling Expert, Manager of Rolling Technology
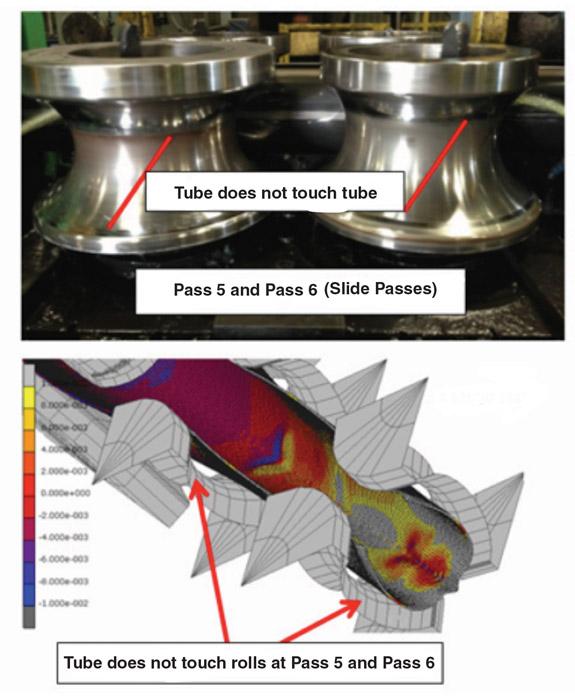
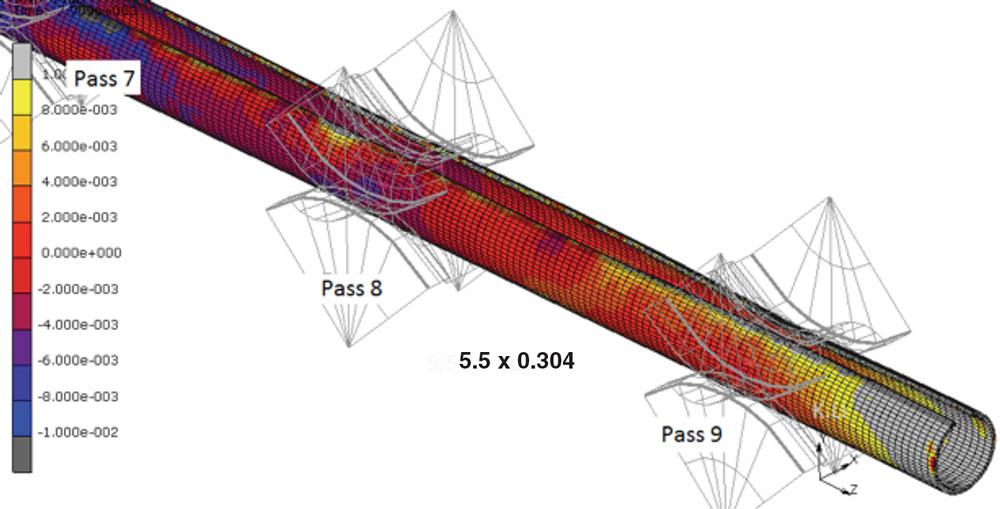
Figure 1
The FEA model predicted that the tube would not contact the side rolls at passes 5 and 6. An examination of the rolls after a production run showed that the strip had made contact at the top edges but not at the bottom edges. At the bottom edges, the gaps were substantial.
The oil extraction industry experienced a confluence of events in the early 2000s that created a revolution. Rising crude oil prices coupled with unconventional extraction processes such as hydraulic fracturing and horizontal drilling provided unprecedented access to hard-to-reach reserves. This, in turn, led to an increased demand for all manner of tube and pipe products, especially oil country tubular goods (OCTG).
At TMK-IPSCO, finite element analysis (FEA) was recently applied to review and improve the forming process of an 8.6250-inch electric resistance welding (ERW) mill for making tube and pipe for OCTG applications. The study investigated the mill load and the causes of flat spots that appeared on some thin-wall products. Although a higher-than-predicted mill load wouldn’t cause an immediate problem, an excessive load on a mill stand likely would cause a bearing failure eventually.
The FEA model in this study focused on metal deformation. The heat input from the induction coil was not a focus in this study; therefore, the FEA model was not coupled with the heat input. However, the welding process was taken into consideration. When the strip reaches the weld box, the pressure developed by the roll tooling forces a small amount of melted metal to be squeezed out of the weld. To account for the material lost during this process, the FEA model was set up with deactivated elements along the strip edges. The quantity of deactivated elements was based on the actual amount of metal squeezed out.
The equipment typically used for the ERW process comprises an uncoiler, accumulator, forming stands, welding stand, seam annealer, and cutoff. Additional steps include finishing and inspection. The various forming passes develop the pipe shape and control its size as the product moves through the breakdown passes, fin passes, welding pass, sizing passes, and Turk’s head. The forming section is the key step—the one that ensures consistent dimensions and weld quality.
The FEA model used the mill layout—four breakdown passes, two side passes, and three fin passes—and tooling and roll gaps based on current tooling drawings and practices. However, this doesn’t mean that the roll gaps are fixed. During a production run, the operator can make slight adjustments to the roll gaps to compensate for variations on the mill. Note that the sizing section was not a factor because this study focused on the forming process, which happens before the material arrives at the weld box.
The material dimensions and characteristics are:
• Slit width: 17.030 in.
• Minimum yield strength: 103,410 pounds per square inch (PSI)
• Ultimate tensile strength: 109,650 PSI
• Total elongation: 23 percent
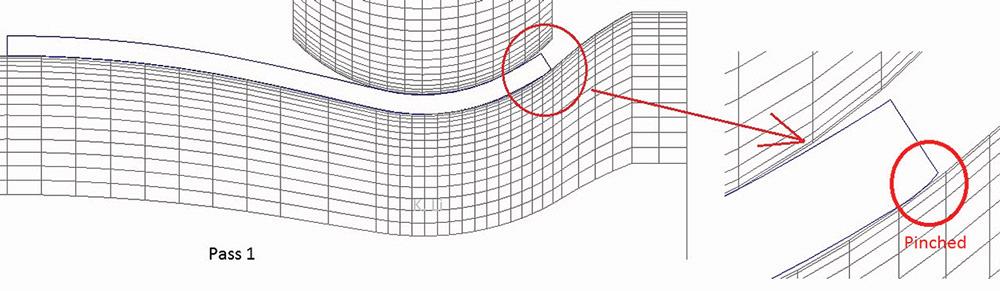
Figure 2
An FEA view of the cross section of the first breakdown pass revealed a small dent. This dent could be validated, if needed, by cutting an edge sample before the first fin pass.
• Final dimensions: 5.5 in. OD by 0.304 in. wall thickness
The author has applied the FEA modeling technology at several ERW tube mills for various applications. 1,2 A useful tool for many manufacturing applications, FEA provides insights and understanding of pipe deformation behavior, which is necessary for forming products successfully. Analyzing how the incoming material deforms at each pass helps to shed light on the mill’s running conditions and production concerns.
Understanding Deformation Behavior. This study focused on an 8.625-in. mill used for making a product 0.188 in. thick. For validation, it relied on a second mill—one used for making 5.5-in.-OD product with 0.304 in. wall thickness.
A review of actual production of the 8.625-in. product showed that the strip did not make contact with the entire roll surface in side passes 5 and 6; the FEA model yielded the same result (see Figure 1), specifically that the strip barely touched the side rolls near the roll edges. This verified that the model provided an accurate prediction of mill results. It also provided a starting point in eliminating the cause of this problem.
In examining the details of making the 5.5-in. tube, the FEA model showed how the stress and strain developed during the forming process led to potential forming challenges and excessive mill loads. The tube formed smoothly—without buckling—through the breakdown and fin passes, but some factors warranted some attention.
1. At the first breakdown pass, the edge was not fully bent (see Figure 2). This isn’t necessarily a problem; in fact, this condition is normal when using one set of breakdown passes for various wall thicknesses. However, the analysis revealed a second concern: the edge was slightly pinched, forming a small dent. This likely would not cause any weld defect because it would be cut off by the OD bead cutter. However, it could pose a problem and therefore it should be monitored.
2. A visual inspection revealed a tiny gap between the formed pipe and the roll on the first side pass, pass 5 (see Figure 3). A large gap usually causes a flat spot on the tube surface, but this gap was not severe enough to cause a forming problem.
The model was based on the designed roll gaps. If the roll gap at pass 5 were reduced slightly, the strip would fit the roll profile completely. Indeed, the strip was in full contact with the rolls in the next pass, pass 6, which led to a good forming profile for the fin passes (see Figure 3). The evaluation determined that pipe deformation was quite reasonable up to pass 6. Also, the pipe edge condition at the breakdown section was examined and found to be acceptable with no edge buckling.
3. Although the material was acceptable as it left the pass 6, observations and analysis indicated that the first fin pass was providing too much reduction. The result was an edge wall that has been built up (see Figure 4), which led to concerns about weld quality. If sufficient material were squeezed out at the weld box, the ID bead cutter would cut that area away; otherwise, a weld defect could occur.
4. The stip edge condition at the fin passes is critical to ensure good weld quality, especially for thin-wall and high-strength material. For forming 5.5-in.-OD by 0.304-in.-wall tube, the strip edges were quite smooth (see Figure 5). The FEA revealed no edge buckle concern in the fin passes, so the weld’s integrity was unlikely to cause problems.
FEA is a good tool to investigate and predict edge deformation behavior before the mill run.
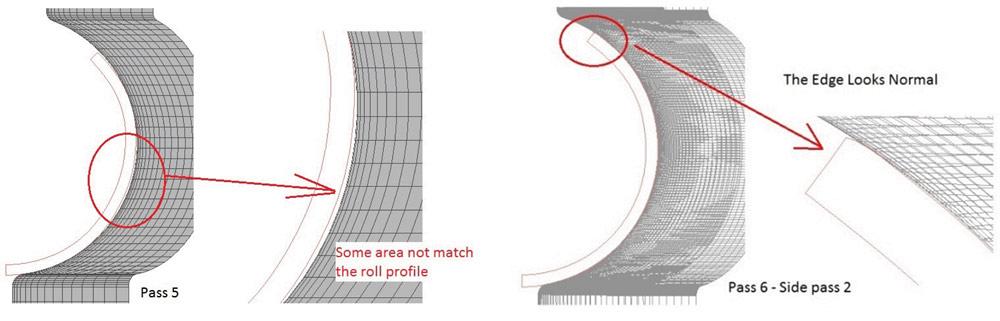
Figure 3
Although the FEA predicted that a slight gap would develop between the material and the roll on pass 5, this wouldn’t amount to a concern because the gap was too small to be significant. As the material exited pass 6, it was ready for the next set of roll tooling.
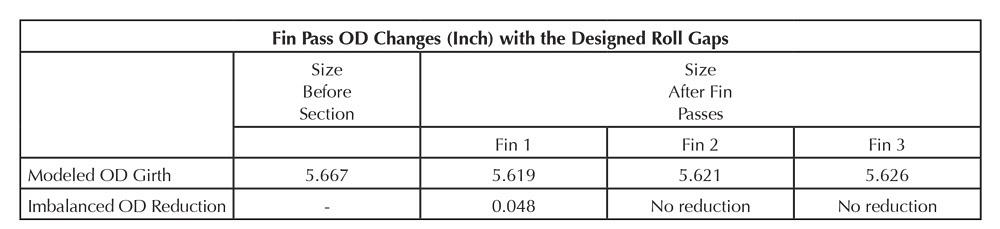
5. To go into more detail, this study examined girth reductions at each fin pass. The model predicted the OD reductions shown in Figure 6, which are based on the designed roll gaps used in the model.
The first fin pass provided a 0.048-in.-OD reduction; the last two provided none. This was done according to the designed roll gaps, but didn’t provide a balanced reduction, relying too heavily on the first fin pass. Another concern was that the strip edge might not be stable before the weld box because of the lack of reduction in the last fin pass.
During a production run, the mill operator may compensate by adjusting the roll gaps so the OD reduction is distributed evenly among the fin passes. For further improvement, the fin blade width can be modified to have uniform OD reduction at each fin pass using designed roll gaps. The proper FEA model can provide good information early in the process for proper tooling design and setup.
6. The modeled tube in the sizing section and exiting the mill at the Turk’s head showed a well-rounded OD, necessary to comply with production specifications.
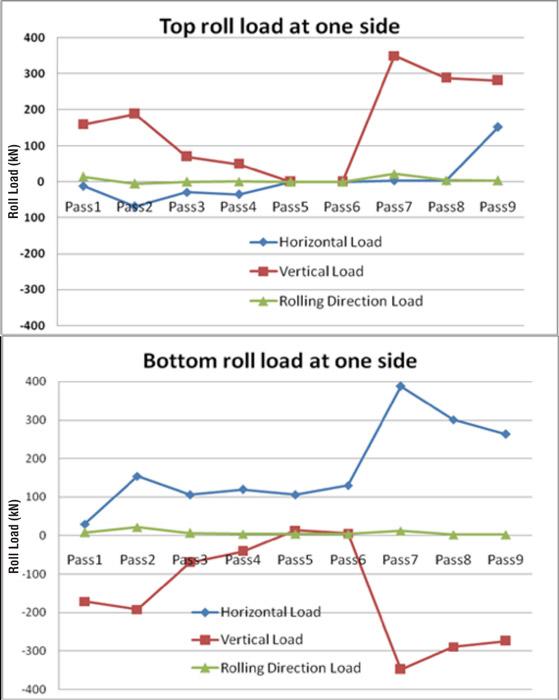
Estimated Load on the Rolls. After the pipe deformation is determined, the forming load can be predicted and analyzed. In this study, the focus was the maximum load and the load trend under the current tooling design and mill setup. The model predicted that the largest load would occur at the first fin pass, pass 7. The total load at pass 7 was quite a bit greater than the load at the breakdown passes. Passes 8 and 9 (fin passes 2 and 3) also had a larger load than the breakdown passes. Therefore, the risk of bearing failure was highest in the fin section, specifically the first fin pass.
The maximum vertical forces occurred in the first fin pass, followed by the second and third fin pass (see Figure7). The roll gaps used in the model in the breakdown passes were set to a skelp thickness of 0.304 in. During production, changing the roll gaps in the breakdown areas caused the roll load in the breakdown passes to change accordingly. Also, variations in the incoming skelp thickness, minimum yield strength, and ultimate tensile strength also affected the mill load in the breakdown pass.
1. The research project indicated a successful outcome. The FEA predicted that the tooling would achieve the necessary amount of deformation for making an acceptable product in the target size: 5.5 in. OD by 0.304 in. tube. The software predicted good-quality, stable strip edges. It did not anticipate edge buckling or flat spots. A mill production run verified the modeled results; everything went as predicted during production.
2. The first fin pass was overburdened, bearing the largest load on the mill and providing the majority of the OD reduction. It bore more stress than the breakdown passes, indicating that the fin load wasn’t evenly distributed. Roll gap adjustments were needed to optimize the process for this product.
3. The FEA also indicated further work would be needed to optimize performance for the larger size, the 8.625 in. OD by 0.188 in. tube.
The author would like to thank the TMK-IPSCO operation team for providing the tooling, mill setup, measurements, and valuable perspectives and insights during this project. Special appreciation is also given to the senior management team for encouragement and support for the launch of pipe modeling technology.
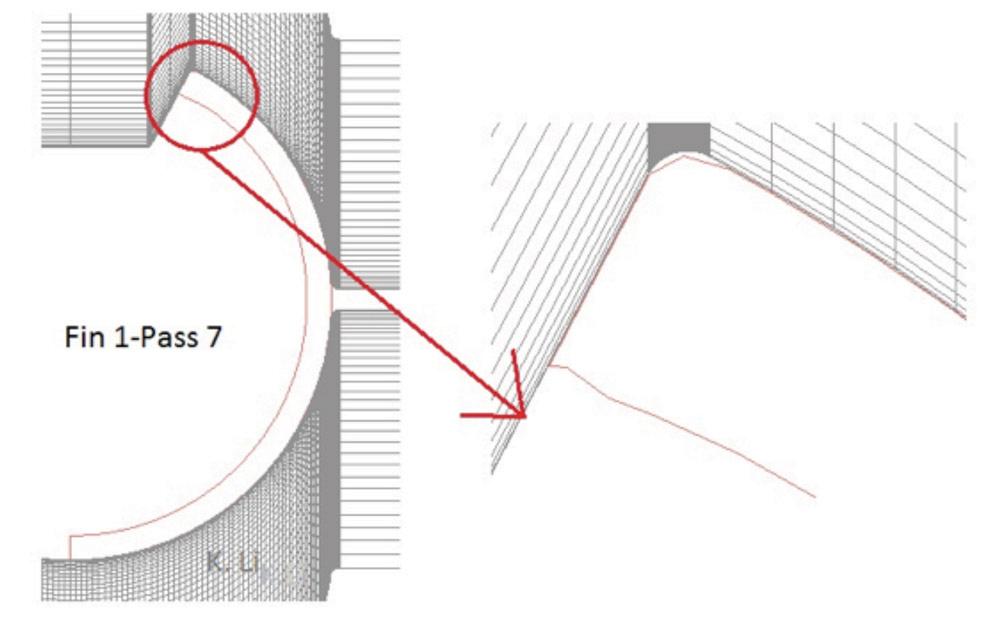
Figure 4
FEA predicted edge wall buildup and the tube profile at the first fin pass.
Notes:
1. Z. Kent Li, “Applications of FEA Modeling to Improve Tube Quality at ArcelorMittal Dofasco Tube Mills,” AISTech 2008, Pittsburgh, May 5-8, 2008.
2. Z. Kent Li et al, “Launching DP780 Light Wall Tube at ArcelorMittal Dofasco,” Pipe & Tube Pittsburgh 2010 Conference, Pittsburgh, Oct. 4-5, 2008.

The Tube and Pipe Journal became the first magazine dedicated to serving the metal tube and pipe industry in 1990. Today, it remains the only North American publication devoted to this industry, and it has become the most trusted source of information for tube and pipe professionals.
start your free subscription
Easily access valuable industry resources now with full access to the digital edition of The Fabricator.

Easily access valuable industry resources now with full access to the digital edition of The Welder.

Easily access valuable industry resources now with full access to the digital edition of The Tube and Pipe Journal.

Easily access valuable industry resources now with full access to the digital edition of The Fabricator en Español.
In this episode of The Fabricator Podcast, Caleb Chamberlain, co-founder and CEO of OSH Cut, discusses his company’s...


