President/CEO
With a tough-talking candidate taking residence in the White House in January 2017, no one expected steel imports to increase this year.
Steel imports and steel prices have behaved in an odd fashion this year. That’s why steel buyers need to consider both history and politics to truly understand the market forces at play.
In 2014 foreign steel imports flooded the U.S. market. That increased rate of imports continued into the first half of 2015, at which time the domestic steel mills filed antidumping (AD) and countervailing duty (CVD) cases on coated steels, cold-rolled, and hot-rolled steels. The U.S. Department of Commerce investigation found most of the accused countries guilty of dumping, and duties were assigned to curb or eliminate imports from those countries into the U.S.
In 2014 total steel imports of all products averaged 3,694,837 net tons per month, with the biggest importers being the domestic steel mills themselves. U.S. steel mills brought in 866,061 net tons of semifinished steel monthly on average (mostly slabs with some billets). Domestic steel mills also were responsible for a portion of the hot-rolled that was imported, which can be traced to mills like USS/POSCO, Steelscape, and CSN.
As seen in Figure 1, OCTG (oil country tubular goods) averaged 332,024 net tons per month, hot-rolled 358,663 tons, cold-rolled 214,660 tons, galvanized 276,105 tons, Galvalume and aluminized 85,076 tons, and plate coils and lengths a combined 331,463 tons.
The U.S. did see total imports decline in 2016 when the monthly average dropped below 3 million tons/month, coming in at 2,751,789 net tons. OCTG dropped to 94,747 net tons, hot-rolled to 239,797 net tons, cold-rolled to 183,509 net tons, galvanized to 258,171 net tons, and plates (coils and sheet) to 207,048 net tons/month, on average. Products designated “other metallic,” which is the U.S. Department of Commerce designation for Galvalume and aluminized steels, did not decline; they averaged 86,138 net tons per month during 2016.
When 2017 began, the 2016 import trend continued into January and February. Those two months averaged 2,768,059 net tons of total foreign steel imports.
Then President Trump announced he had charged Commerce Secretary Wilbur Ross with investigating whether a healthy domestic steel industry is essential to U.S. national security. The belief by most in the steel community was that the results were “fixed,” and that Section 232 trade actions against foreign steel imports were inevitable. The prospect of losing access to foreign suppliers did not move steel buyers to buy more domestic steel, however, but just the opposite. The amount of foreign steel being imported into the U.S. once again jumped close to the 2014 pre-AD/CVD levels. The months of March, April, May, June, July, August, and September averaged 3,443,274 net tons of imported foreign steel.
As seen in Figure 1, imports of foreign cold-rolled steel are averaging 224,655 net tons, which is approximately 10,000 tons more per month more than the pre-AD/CVD year of 2014. Galvanized steel imports also are above 2014 levels, now averaging 293,914 net tons. Steel Market Update (SMU) also is seeing the “other metallic” steel, mostly Galvalume, averaging 105,467 net tons/month, which is considerably more than the 2014 average of 85,076 net tons.
SMU expects foreign steel tonnages to drop in the coming months, not so much because of further government trade actions, but because of ordinary market forces. Foreign steel prices have been rising. The areas where we expect foreign imports to continue to win market share from domestic mills is in cold-rolled and coated steels. These are the products for which the domestic mills raised the traditional spread between their base prices and that of hot-rolled coil. What was once a $100 to $120 per ton spread was pushed to $200/ton. The SMU Steel Index reported hot-rolled as averaging $600/ton during the week of Nov. 6; cold-rolled base pricing $185/ton higher; galvanized $170/ton higher; and Galvalume $200/ton higher than the hot-rolled average base.
As many of you know, the administration has put off a decision on Section 232 until after tax reform legislation has been completed. The report from Ross is due to the president in mid-January, after which he has 90 days to act on it. At this point, most governmental observers believe that if anything is to happen, it won’t occur until mid to late Q1 2018. And it no longer seems like a slam dunk that the steel industry will reap any benefits from Section 232. SMU has been hearing from steel mill executives who say they never asked for 232, have no expectations, and are now concentrating their efforts on traditional AD/CVD trade remedies.
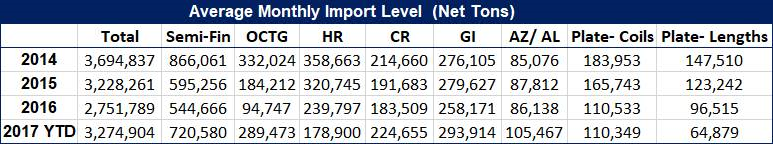
Figure 1. Certain types of steel imports have had incredible swings in shipment numbers over the past several years.
A Word About Service Center Inventories
Previously I have spoken about the new proprietary analysis SMU has been working on to measure the number of months of inventory flat-rolled steel distributors are carrying on their floors at the end of each month. As of mid-November, we have just completed our analysis, and the months of supply of flat-rolled on service center floors in the U.S. at the end of October is essentially the same as what we recorded at the end of September. With 90 percent of the registered service centers reporting, inventories stood at 2.86 months of supply at the end of October compared to 2.89 months at the end of September. (Note: As we add service centers, we revise previous months of supply as new data becomes available.)
Looking at the data a little closer (see Figure 2), 50 percent of responding companies reported their inventories as shrinking compared to the previous month. The changes were mostly subtle (2.90 down to 2.88 months of supply, for example). Of those reporting a decline in the number of months of supply, only four companies reported a change of half of a month or greater, because of mill orders being late or stronger sales than anticipated in October.
Forty percent of the responding companies reported their inventories as rising. Much the same as those who reported a decline, the spread between October and September was very narrow. Only one company reported a change greater than half of a month of supply. That company reported that all its inventory is sold, and it has no spot inventory available to sell. Of those reporting growing inventories, we heard reports of companies receiving large shipments of foreign material or building stock to protect margins on steel that was already sold.
Ten percent of the companies reported their number of months of supply as being the same as the prior month. No one expressed any comments or concerns about having too much or too little inventory.
At the beginning of November, we asked service centers if their inventories were balanced or at a level where they needed to consider buying more inventory. We noticed a small change in the percentage of service centers that reported they were either building inventory now or would be shortly. At the beginning of October, only 6 percent of the respondents reported building or soon to be building inventory. The percentage of service centers reporting a need to build inventory either now or soon grew to 14 percent as of the beginning of November.
If you have any interest in learning more about steel pricing trends or the steel market in general, consider these 2018 events:
Details on all events, as well as information about SMU newsletters, can be found at www.steelmarketupdate.com or by calling 800-432-3475.
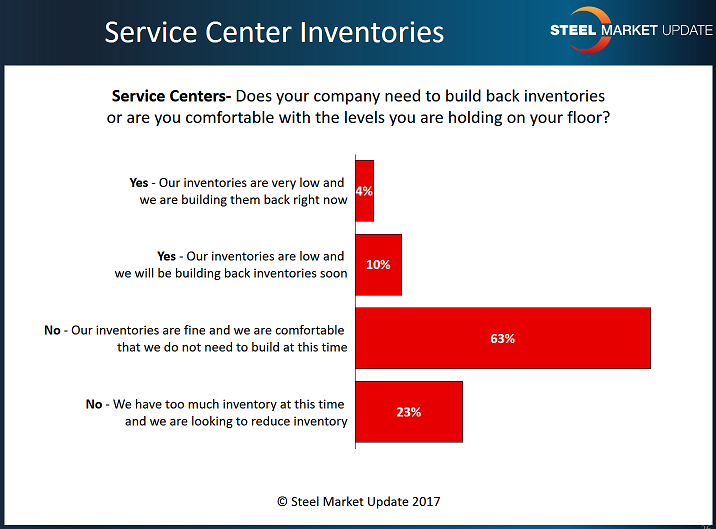
Figure 2. Inventory levels of flat-rolled steel appear to be very stable among the distributor base.

The Fabricator is North America's leading magazine for the metal forming and fabricating industry. The magazine delivers the news, technical articles, and case histories that enable fabricators to do their jobs more efficiently. The Fabricator has served the industry since 1970.
start your free subscription


Easily access valuable industry resources now with full access to the digital edition of The Fabricator.

Easily access valuable industry resources now with full access to the digital edition of The Welder.

Easily access valuable industry resources now with full access to the digital edition of The Tube and Pipe Journal.

Easily access valuable industry resources now with full access to the digital edition of The Fabricator en Español.
In this episode of The Fabricator Podcast, Caleb Chamberlain, co-founder and CEO of OSH Cut, discusses his company’s...