How much should a gallon of gasoline cost?
The unthinkable has happened: Gasoline prices have crossed the $5.00-per-gallon threshold. Forget the official data. The Energy Information Administration says that the average retail price for a gallon of regular unleaded gasoline is $3.96, but that’s not accurate for two reasons. First, it excludes taxes, and second, that was last week. This might sound silly, but prices have been rising quickly, so we need fresh data, data from this week. The most up-to-date information is at the pump. In my area (90 miles west of Chicago) it’s a bit more than $4 per gallon, but I heard from a friend recently that it’s $5.00 per gallon at some stations in Chicago. I hesitate to ask how much stations in California are charging.
Two questions come to mind. First, how are higher gasoline prices likely to affect the rest of the economy? My colleague Vicki Bell wrote about this in a recent blog. Let’s move on to the next question: How much should a gallon of gasoline cost? There is no easy answer, but we can piece together some trends and draw a conclusion.
First we need a baseline price. Let’s go all the way back to the oil embargo of 1973-1974. According to the EIA, the retail price for gasoline increased 50 percent between late 1973 and early 1975 (don’t laugh … the increase was from 40 cents per gallon to 60 cents per gallon).
Even though the 50 percent price increase was a big kick in the tail for U.S. consumers, 60 cents per gallon probably reflected market conditions more accurately than 40 cents per gallon, so let’s start there. If little had changed in the past 36 years and we had to account for inflation only, we’d expect to pay $2.37 per gallon today.
What has changed? The supply, for one thing. We can’t keep pumping oil from the same old wells. When a well runs dry (or, more accurately, when it becomes too depleted to be profitable), we abandon it and move on to the next location, and in doing so we move on to ever-more-remote locations and drill deeper than before. This pushes the extraction cost upward. The industry also has gone to double-hulled tankers, and the tankers themselves use petroleum-derived fuel, so a higher oil price drives up the cost to ship every barrel of oil. No doubt myraid other changes, small and large, have changed the dynamics of supply over the past few decades.
Second is the demand. I couldn’t find data spanning 1975 to the present, but from 1980 to 2006 the world’s consumption of petroleum increased 35 percent.
Technology has changed too. In addition to pumping petroleum (in its liquid form), we also pull it out of bituminous sands, also known as oil sands and tar sands, where it exists in a semisolid form. The extraction processes for deriving oil from bituminous sands are more expensive than pumping oil, but they are profitable these days and have done wonders for U.S-Canada relations and decreased U.S. dependence on oil from the Middle East. It also sheds light on the origins of a certain NHL team’s name.
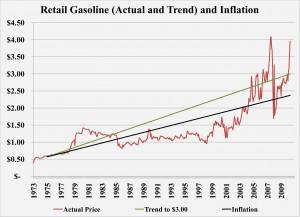
So where does this leave us? I made a graph that shows the average U.S. price for unleaded, regular-grade gasoline, inflation, and a trend line that brought the gasoline up to $3.00 per gallon. I have to confess I used more guesswork than math, but the graph looks reasonable, and it adheres to the actual price trend—according to the EIA, gasoline was about $3.00 per gallon in December (again, taxes not included).
Based on this price, gasoline was a bargain for nearly 20 years, and the rapid price increase in 2011 is temporary, mainly attributable to the political developments in Egypt, Tunisia, and Libya, which started in January.
I guess that brings up a third question: How soon can we expect gasoline prices to drop? We have to get past hurricane season and the summer driving season, then we’ll see.
subscribe now

The Fabricator is North America's leading magazine for the metal forming and fabricating industry. The magazine delivers the news, technical articles, and case histories that enable fabricators to do their jobs more efficiently. The Fabricator has served the industry since 1970.
start your free subscriptionAbout the Author

About the Publication
- Stay connected from anywhere

Easily access valuable industry resources now with full access to the digital edition of The Fabricator.

Easily access valuable industry resources now with full access to the digital edition of The Welder.

Easily access valuable industry resources now with full access to the digital edition of The Tube and Pipe Journal.

Easily access valuable industry resources now with full access to the digital edition of The Fabricator en Español.
- Podcasting

In this episode of The Fabricator Podcast, Caleb Chamberlain, co-founder and CEO of OSH Cut, discusses his company’s...
- Trending Articles
1
AI, machine learning, and the future of metal fabrication

2
Employee ownership: The best way to ensure engagement

3
Steel industry reacts to Nucor’s new weekly published HRC price

4
Dynamic Metal blossoms with each passing year

5
Metal fabrication management: A guide for new supervisors