


Co-founder

Editor’s Note: This installment in a series of articles intended to help metal fabricators improve their commercial engines and grow their businesses is divided into two parts.
Your manufacturing company is designed around your customers – your location, your staffing, your facilities, and, of course, your products and services. Are you focusing on the right end markets that bring you the most value? How do you know for sure?
Nearly every manufacturer has the capacity to serve more than one end market. A fabricator in the construction industry also can make signs, and a shop serving the aerospace industry can reach portions of the medical industry. Diversity is good. But strong, sustainable business success comes from aligning your business structure, staffing, messaging, facilities, and offerings to match the customer needs of your market.
And markets change.
Your offering might have been spot-on in 2008, but missing the mark in 2018. Evaluating, or re-evaluating, your end markets to ensure you’re pursuing the best is the first step to a healthy commercial engine.
Finding or confirming your best end markets should be easy, right? You make a list of your best customers, identify their end markets, look for end market commonality, and make your choice. Although such an approach does seem easy, once you get started you’ll soon find that the devil is in the details. For example, how do you define “best”? Are your best customers automatically those who provide the most revenue, or those that provide the most gross profit (revenue minus cost of goods)? And what about market size? Are your best customers residing in markets big enough to sustain your business success?
Even if your company has been in business for 100 years, taking a serious look now and again at your most valuable end markets is an important exercise – one that can help you avoid your markets changing without you.
The two most important criteria are pocket income and market viability. This article discusses pocket income. Part II focuses on market viability.
Pocket Income. Pocket income is the bottom-line profitability generated by a customer after subtracting the internal costs to serve that customer. It compares the profit value of one customer against the average customer after accounting for the cost to serve.
If a top-revenue-generating customer drains a significant amount of time and money from service, management, and engineering, the cost to serve reduces your bottom-line profit value. Pocket income analysis is performed first so that only a few customers will require a market viability analysis.
Image courtesy of Chip Burnham, Fairmont Concepts.
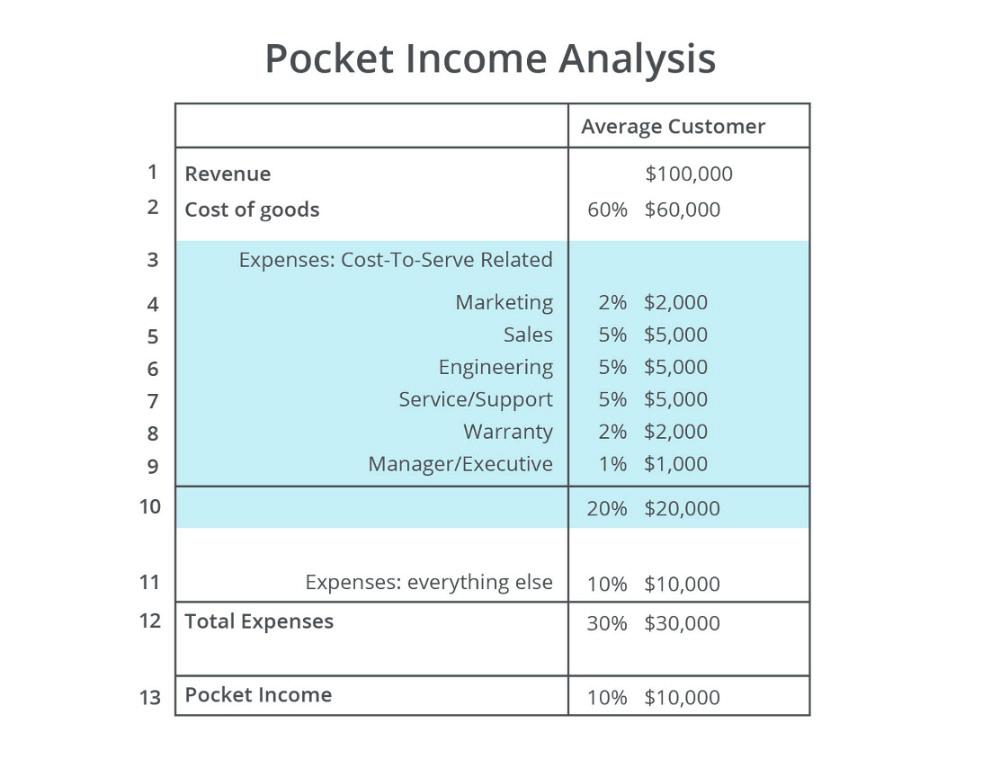
Perhaps you have heard the terms pocket price and pocket margin made popular by McKinsey & Co. These terms reflect the erosion of price after invoice, as caused by hidden discounts, rebates, or free freight. Pocket price and pocket margin are transaction analyses. Pocket income, on the other hand, is a broader and more subjective analysis that spans all transactions over a given time period (usually two to three years). It takes the form of a mini-income statement, as shown in the following example (Figure 1). Creating a pocket income table requires assistance from someone with financial expertise.
The table shows the average pocket income for all customers. The shaded areas represent the average cost to acquire and service the customer, as estimated by finance and company experts on a departmental basis. Line 13 shows the aggregated pocket income dollars and percentage of the entire customer base (download template).
With the average pocket income data in hand, you’re now in a position to compare your potential best customers against the average customer to identify those delivering the highest overall value (the highest pocket income percentage and dollars). This allows you to avoid the pitfall of focusing your commercial engine on an end market full of demanding customers that drain you of your bottom-line profit.
Follow these steps to create a pocket income table.
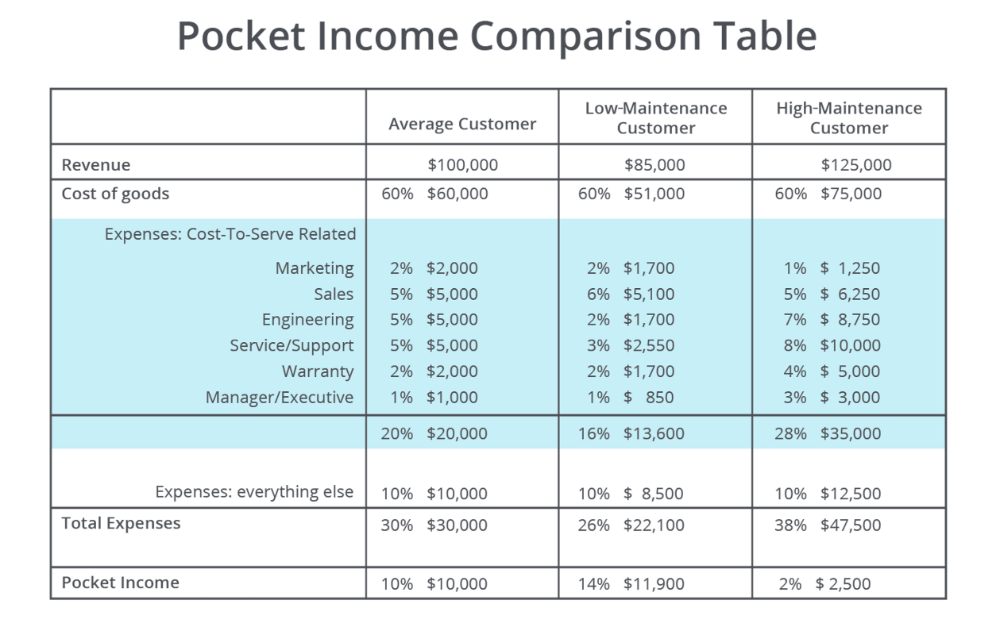
Figure 2 shows a comparison of two hypothetical customers against the average customer. “Low maintenance customer” drains few resources from the company, while “high-maintenance customer” shows a significant drag on profitability.
The low-maintenance customer delivers a high pocket income percentage (14) even though the revenue of $85,000 is slightly below average. The cost to serve this customer is considerably lower than average. This company is a money-maker. Your cross-functional team of department experts agrees that this is a highly satisfied customer that demands few engineering resources. It has trained its own staff to service and maintain your equipment and only seeks your help under unusual circumstances.
The sales staff spends slightly more time with them than with the average customer, but there is no increase in management or marketing expenses versus an average customer. The analysis shows an excellent pocket income percentage and good pocket income dollars.
Conversely, the high-maintenance customer looks favorable based on a quick glance at the revenue and COGS lines, but profitability erodes in the expense area. The team agrees that the cost to serve this customer is high. It is demanding and sometimes unreasonable. It drains significant resources from the technical support team, managers, and executives, and costs significantly more in time and money than the average customer. The constant barrage of service demands, product changes, and executive interaction drive up the cost to serve this difficult customer. The pocket income percentage and dollars are so low that the customer does not make the cut to be included in the market viability analysis.
While both customers look attractive from the viewpoint of revenue minus COGS, a deeper look into the cost to serve shows one customer to be far more valuable than the other.
Conducting this pocket income analysis is not as time consuming as it might appear. After all, you are merely comparing customers against the average customer based on their cost to serve. Pocket income analysis delivers a subjective ranking. This important analysis is now followed up with a market viability check. Before pointing your commercial engine at your best customer’s end market, make sure there are enough prospects in that end market to sustain a successful business.
Part II of this article, Finding Your Best End Market – Part II Market Viability Analysis, will show you how.


The Fabricator is North America's leading magazine for the metal forming and fabricating industry. The magazine delivers the news, technical articles, and case histories that enable fabricators to do their jobs more efficiently. The Fabricator has served the industry since 1970.
start your free subscription
Easily access valuable industry resources now with full access to the digital edition of The Fabricator.

Easily access valuable industry resources now with full access to the digital edition of The Welder.

Easily access valuable industry resources now with full access to the digital edition of The Tube and Pipe Journal.

Easily access valuable industry resources now with full access to the digital edition of The Fabricator en Español.
In this episode of The Fabricator Podcast, Caleb Chamberlain, co-founder and CEO of OSH Cut, discusses his company’s...


