Co-founder

Editor’s Note: This is another installment in a series of articles intended to help metal fabricators improve their commercial engines and grow their businesses.
Whether your company is relatively young or has been in business for 100 years, taking a serious look now and again at your most valuable end markets is an important exercise—one that can help you avoid your markets changing without you.
The two most important criteria for selecting your best end market are pocket income and market viability. This article discusses market viability. Part I focused on pocket income.
After performing the pocket income analysis, you have your list of 10 to 30 best customers. Now, it is time for you to identify the end markets in which they reside and research the market viability of those markets.
Hot markets can burn out fast—sometimes because of market change, but usually because the hot market had too few prospects. Before you align your commercial engine to pursue an end market, you must make sure it contains enough worthwhile potential customers to sustain and grow your business.
How broadly should you define your end market? For example, if you are a sheet metal fabricator and one of your best customers is a mini-fridge maker, do you define the target market as mini-fridge makers, appliance makers, or cut and formed sheet metal makers?
A common way of looking at the universe of your addressable market is illustrated in the familiar circle graph shown in Figure 1.
The total available market (TAM) is the entire prospect universe for all of your products and those of your competitors now and in the future. The serviceable available market (SAM) represents a market realistically reached by your organization and your competitors at this time. The serviceable obtainable market (SOM) is the subset of the SAM you believe you can reasonably capture with your current business structure and products. Some marketers then add a fourth, even smaller circle called penetrated market, to reflect the customer base.
It’s easy for a marketing team to make the mistake of overstating market potential; all they have to do is show the TAM, and nearly every market is projected to be huge. Avoid the TAM.
Your criteria should really come down to this: If you have no intention of modifying what you do (marketing, sales, product, support, geographic reach), you should look at the SOM. If you are willing to make changes and additions to your commercial reach, then you can consider the SAM.
How do you identify your SAM or SOM size? Conduct primary and secondary research. Primary research is talking directly to experts or individuals in the market and drawing conclusions from your own data. Secondary research is analyzing published material.
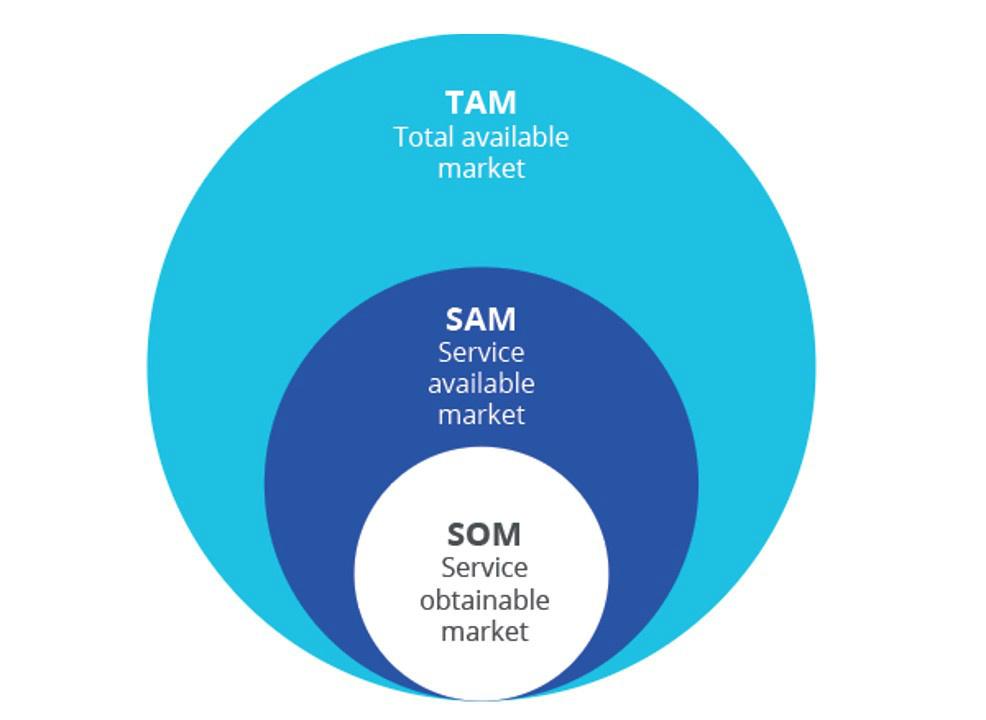
Figure 1
Conducting secondary research on target markets, especially those with little publicly available information, can be difficult. Search online to learn the language and business nuances, and to seek relevant information.
Sources for secondary research include:
Conducting primary research takes time and energy. You are creating the data through your own research effort, usually in the form of interviews. Many interviews will be short—likely 15 minutes or less—so focus on a few key questions. Treat your interview like a discussion, not an inquisition. Use open-ended questions designed to start a dialogue, and follow the thread of the conversation to keep your contact talking.
Sources for primary research include:
Beyond helping you choose which end markets to pursue, the primary and secondary research you conduct also helps you execute your commercial marketing and sales plans. Make note of the language your contacts use, the needs they mention, the go-to market channels they prefer, the benefits and features they desire, and any relevant buyer journey information. This is valuable data you can use if you select that end market.
Once you have completed your pocket income (see Part I), market viability analysis, and primary and secondary research, you can create an end market selection table to help you make your final decisions and explain your decisions to others.
Market analysis for all but the largest industries is not an exact science. It may be more helpful in your decision-making to compare the potential of the various end markets you are considering against each other. Putting together a table like the one shown in Figure 2 enables you to review your target end market finalists at a glance. The table is a catalyst for informed debate.
Although your final selection table may look simple, the data behind it can be complex. Let’s use an example of a small, custom-vehicle manufacturer.
ABC Custom Truck Works is a New Jersey-based company that also covers New York and Connecticut. It customizes mid-sized vehicles (class 3 through class 6) and trailers built off pickup trucks, vans, and cube vans.
Of the 400,000 to 500,000 new vehicles sold per year in the U.S. by all competitors combined, slightly more than 15,000 vehicles are sold within ABC’s geographic coverage area. The company was founded to manufacture landscaper vehicles and trailers 15 years ago. It now sells 400 trucks annually and offers aftermarket accessories and services. Although landscapers remain its largest revenue generator, the company also has sold vehicles to plumbers, electricians, emergency response teams, town road crews, private snow plow operators, farmers, shipping companies, and a host of other small markets.
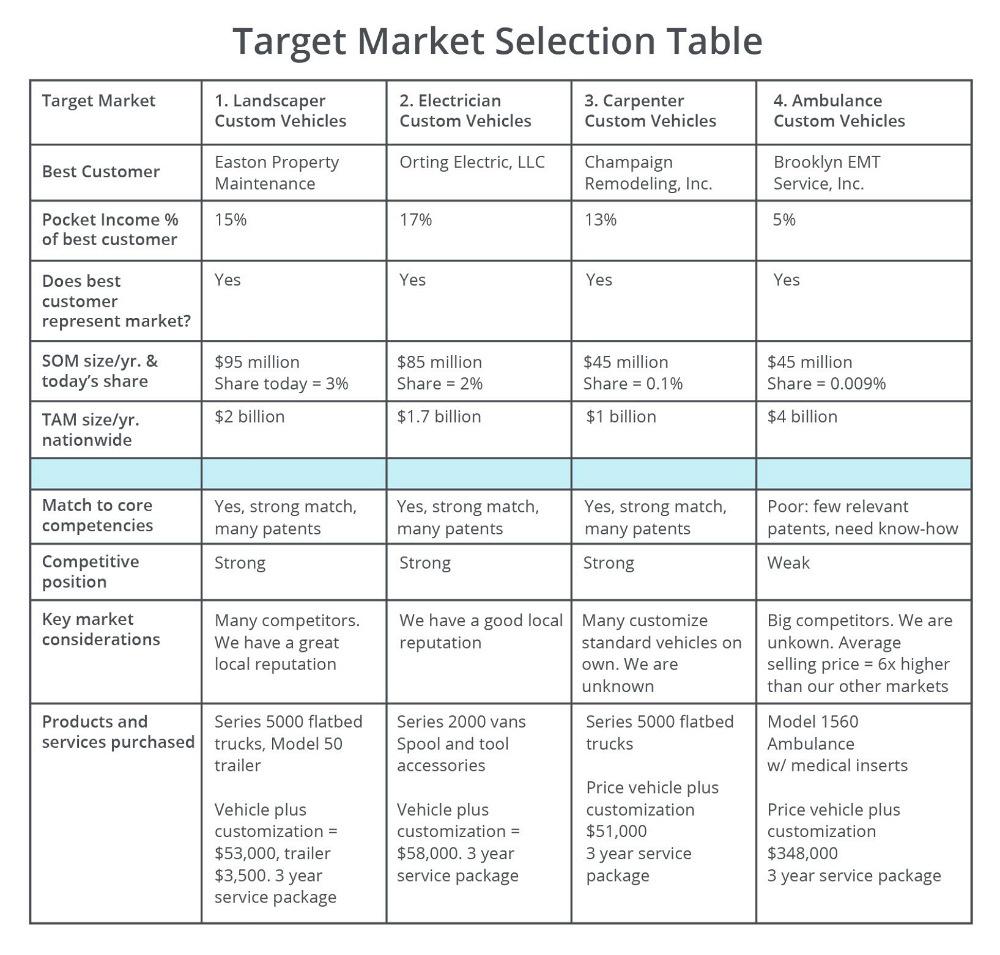
Figure 2
ABC conducted a pocket income analysis of its customer base, conducted primary and secondary research on the end markets of the best-performing customers, putting it in a position to select its target end markets. Four markets—landscapers, electricians, carpenters, and emergency response teams—have made the list. The company wanted to reduce this number further, down to two or three target end markets.
ABC developed the table In Figure 2 to help make informed decisions (download template here).
Based on the results in this selection table, the company’s marketing and leadership team made the following observations and decisions:
In this example, ABC Custom Truck Works could have expanded the table to include the compound annual growth rate (CAGR) and other ratios and criteria. Deciding how detailed to make your target market selection table is up to you.
There you have it. Identifying or reevaluating your best end market is a vital exercise, one that will ensure you are selecting the right direction for your business.
The next article in this series continues the path to a healthy commercial engine with a tried-and-true method of obtaining the voice of the customer and putting that voice into highly usable formats.


The Fabricator is North America's leading magazine for the metal forming and fabricating industry. The magazine delivers the news, technical articles, and case histories that enable fabricators to do their jobs more efficiently. The Fabricator has served the industry since 1970.
start your free subscription
Easily access valuable industry resources now with full access to the digital edition of The Fabricator.

Easily access valuable industry resources now with full access to the digital edition of The Welder.

Easily access valuable industry resources now with full access to the digital edition of The Tube and Pipe Journal.

Easily access valuable industry resources now with full access to the digital edition of The Fabricator en Español.
In this episode of The Fabricator Podcast, Caleb Chamberlain, co-founder and CEO of OSH Cut, discusses his company’s...