


Co-founder

Editor’s Note: This is another installment in a series of articles intended to help metal fabricators improve their commercial engines and grow their businesses. (See Part I here.)
Voice of the customer (VOC) research is fundamental to creating a strong commercial engine. Too often companies rely on legacy opinions rather than sound, unbiased research. Conducting objective VOC research periodically enables you to modify your company structure, offerings, and interactions to match the ever-changing marketplace.
Part I of this two-part article covered the importance of conducting objective VOC research, how to set up your interview plan, and how to conduct interviews. Part II covers how to pull the needs out of the interviews and create the two deliverables, the Primary Needs Table and the Market Opportunity Map. The overall approach is based on a system developed by Applied Marketing Science, in Boston.
To complement this article, Fairmont Concepts is hosting a webinar on this approach April 11, 2018, 11 a.m. Pacific, 2 p.m. Eastern. Click here to sign up for the webinar, or download it if the webinar has already taken place.
These five steps (Figure 1) are used to conduct the VOC research. Steps 1, 2, and 3 were covered in Part I:
These last two steps create the Primary Needs Table and the Market Opportunity Map. We pick this approach back up at Step 4.
Step 4. Identify and sort the VOC needs.
At the conclusion of Step 3, you have written transcriptions of all interviews. Now you must extract the needs from these transcriptions.
As you work your way through the printed transcriptions, identify all needs phrases, highlight them in the transcription, and copy them onto a spreadsheet. It is best if two people work independently to pull needs from each transcript; this ensures a thorough scrubbing. Duplicates are removed later.
Look for needs that are characteristics, such as “Quick loading and unloading of equipment,” or solutions, such as “Give me a button on the dashboard that does this,” or target values, such as “I want to unload equipment in 30 seconds.”
Look for opinions, such as “It takes too long to get the equipment unloaded,” and for clearly articulated wants and needs, such as “I want to increase productivity and not waste time loading and unloading my equipment.”
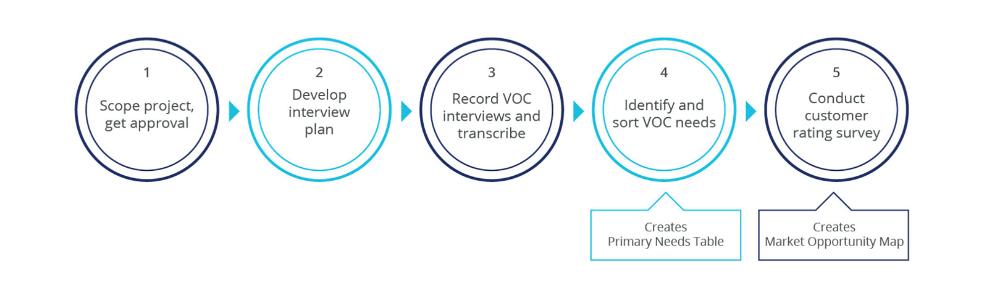
Figure 1. VOC research steps
Needs and usable comments come in different types. Some are ingredients for the Primary Needs Table, and some are not.
Qualitative needs for ABC Custom Truck Works (a fictitious company introduced in Part I that customizes vehicles for the landscaper end market) might include phrases such as these:We must have enough fuel to get us at least through lunch.
Remove duplicates, solutions, and opinions. Your goal is to develop a list of “pure” qualitative needs, devoid of duplicates, target values (“I need 10 of each”), solutions (“If you could just redesign the widget to be thumb-operated…”), and opinions (“Blue is cool”). Target values and solutions and opinions suggestions should be put to the side. This information is valuable to product development and service departments’ continuous improvement efforts, but does not constitute primary needs.
Duplicate responses are removed because repetition doesn’t necessarily correlate to importance. It might simply correlate to being obvious. Step 5 prioritizes the importance of the needs relative to each other.
Review the phrases on your spreadsheet. If a customer’s words perfectly describe the need, leave the phrase in quotes and do not change them. Quotes will be helpful when it comes time to use the needs information for content copy (with the customer’s permission, of course). Quotes also prove to your company that you left the needs in the customers’ own words where possible. If the customer’s wording is not clear or is too lengthy, then rephrase the comment and remove quotation marks.
Your list of 400 to 1,000 needs pulled from the transcripts typically ends up to be 75 to 300 final qualitative needs. Now it’s time to create the all-important Primary Needs Table list of 12 to 25 primary needs in three to seven needs families. ABC’s example is shown in Figure 2.
To create the primary needs table, print each need clearly on a slip of paper so that it can be easily handled. Bring in a review team of two or three well-informed customers, and conduct the needs-sorting exercise in which they place the needs into related groups. You will need to be with them to help them along. If you are unable to recruit customers, use knowledgeable individuals from within your company, but only as a last resort. Using customers instead of your own staff removes biases and keeps results truly customer-driven. This step takes about an hour.
Before you have customers perform this sorting exercise, I recommend you show them a finished example (such as Figure 2) so they understand the goal of the exercise.
Have the reviewers sort the needs individually, compare results, and then finalize together. They often choose to start over when they work together for the final set. Instruct them to look for needs that “go together.” Divide large groups of needs into smaller groups. Some may have only one or two needs, and that is acceptable at this point. Later, help the reviewers place these outliers with another needs group when the exercise is completed, or leave them separate if they truly represent a unique customer need.
Have the review team create a label that summarizes each needs group and continue until they have 12 to 25 primary needs grouped into three to seven families. It is important that the reviewers doing the sorting create the primary needs label and family header so that terms reflect the customers’, and not the supplier’s perspective.
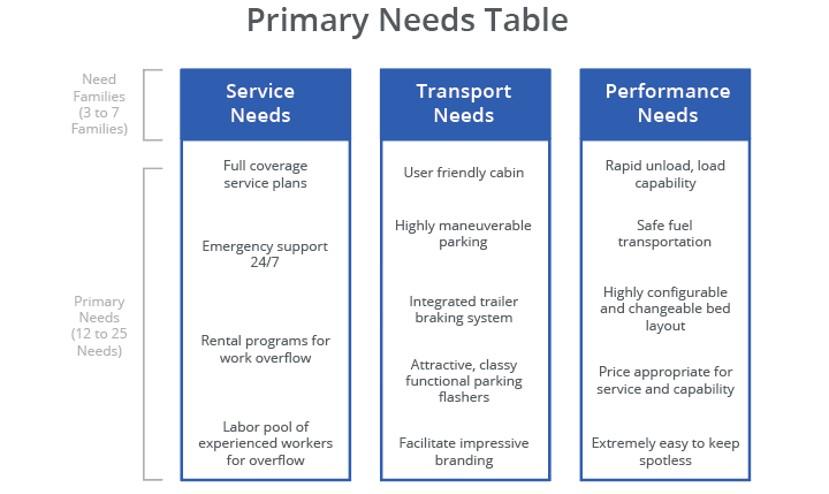
Figure 2. Primary Needs Table example
When finished with this step, your customers will have created your Primary Needs Table. You now have a comprehensive list of primary needs grouped into families. It was created by a careful process, delivering objective results, and you now have a clear picture of your target end market. You have revealed many needs you expected, and others might be a surprise.
As a reminder, retain the numerous specific needs that comprise each primary need to be leveraged for more detailed analysis later. Many of these needs are in the customers’ own words and provide great insight. If one of the primary needs was, for example, “Emergency support 24/7,” then the individual needs that comprised that group will be helpful when the service team looks to improve its emergency support programs.
The Primary Needs Table example for ABC Custom Truck Works (Figure 2) shows three families of primary needs related to service, transportation, and performance. These three families comprise a total of 14 primary needs.
Step 5. Conduct the customer rating survey.
You can gain even further insight by conducting one more exercise to create the Market Opportunity Map. In this final step, survey a large customer audience via email and have them rate the needs from 1 to 10 on two factors:
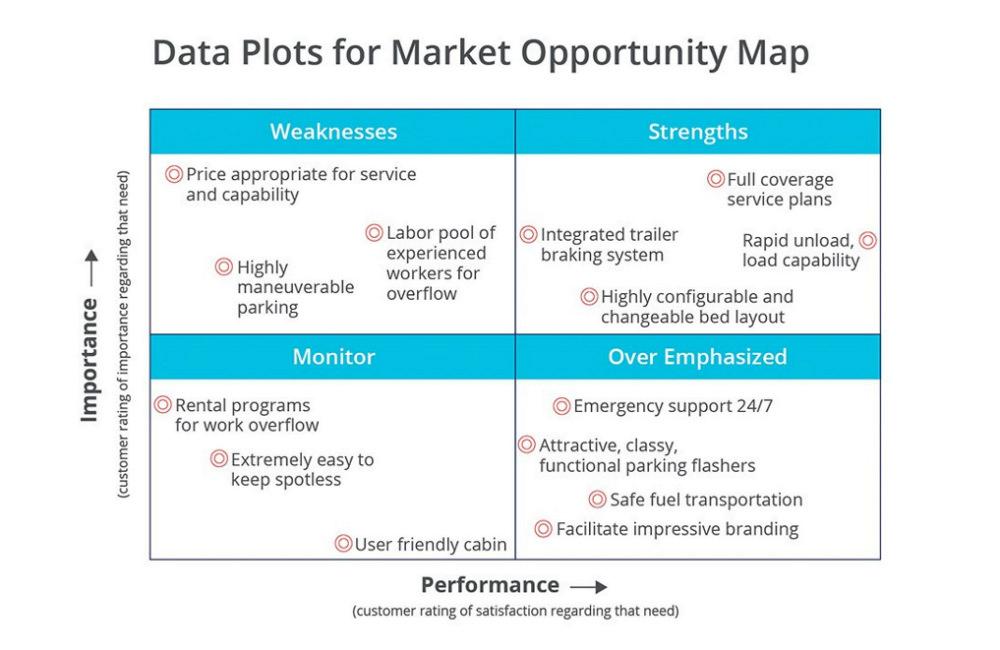
Normalizing and graphing the data result in a powerful visual map, as shown in Figure 3, which is an example from ABC Custom Truck Works.
Email the survey to a group large enough to ensure 50 to 300 responses; the more responses the better. Be sure to cover a comprehensive cross section of your target market.
The process for conducting the email survey includes finding an online survey company, creating the email survey, sending out the survey, and scrubbing the data.
Find an online survey company. If you’re surveying a global market, select a vendor capable of handling an international program. Translate as needed. Always track the survey recipients so you can sort the results based on demographic variations.
Some companies that conduct these types of surveys are Survey Monkey, Typeform, Google Forms, Zoho Surveys, Survey Gizmo, Survey Planet, Campaign Monitor, Zoomerang, GetFeedback, Checkbox, eSurveysPro, SoGoSurvey, and FluidSurveys.
Create the email survey. Use best practices in the email design to help ensure high open and click-through rates (see Solution 4, Generating More Leads, in our book for advice, or search Google under “email best practices”). Ask each respondent to rate your final 12 to 25 primary needs. For each need, you’ll ask them to respond to two survey questions:
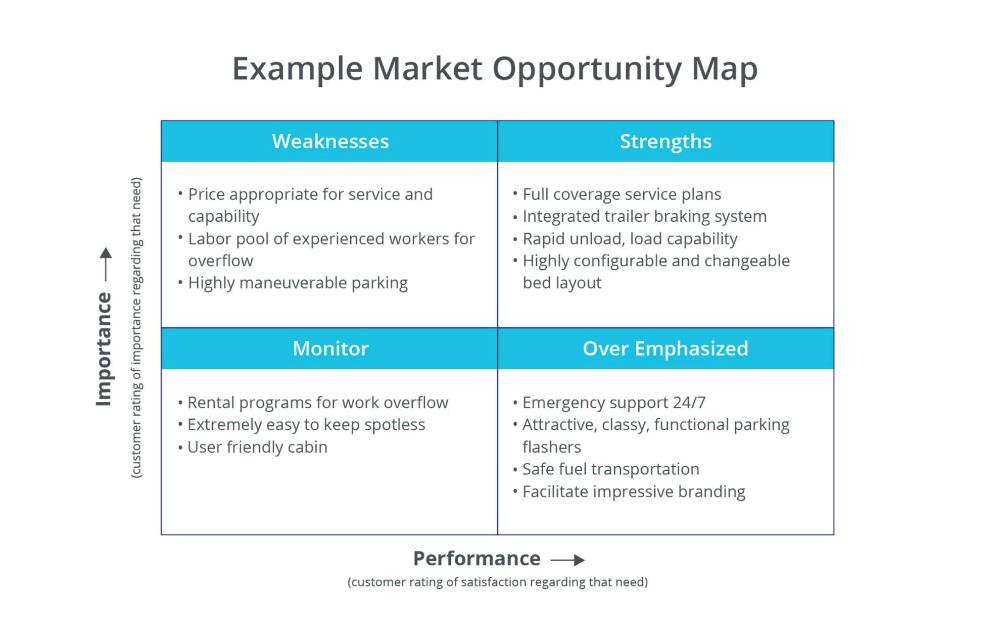
Figure 3. Market Opportunity Map example
Send the email survey. Send the survey to as large an audience as you can within your target market. The response rate to your email survey depends on many factors, such as your end market, the title of the person you are trying to reach, and the closeness of the relationship you hold with that customer. You can expect a 2 to 5 percent response rate. Increase the response by providing an appropriate incentive (if allowed), or calling ahead to alert the customer of the email and your hope that they take a few minutes to participate. Incentives and precalls can raise your response to 8 to 12 percent. Use the same email best-practice techniques you would for a marketing campaign.
Scrub results and normalize the data. Once you have your data, build your Market Opportunity Map (Figure 3). The map provides a clear picture of the areas of strength that you should promote more heavily, along with areas in which you need to improve your offerings. It illustrates the priorities that are truly important to the target market.
Scrub the results by eliminating responses that follow any pattern that suggests the respondent did not take the survey seriously (all 10s, all 1s, alternating 1 and 2, etc.).
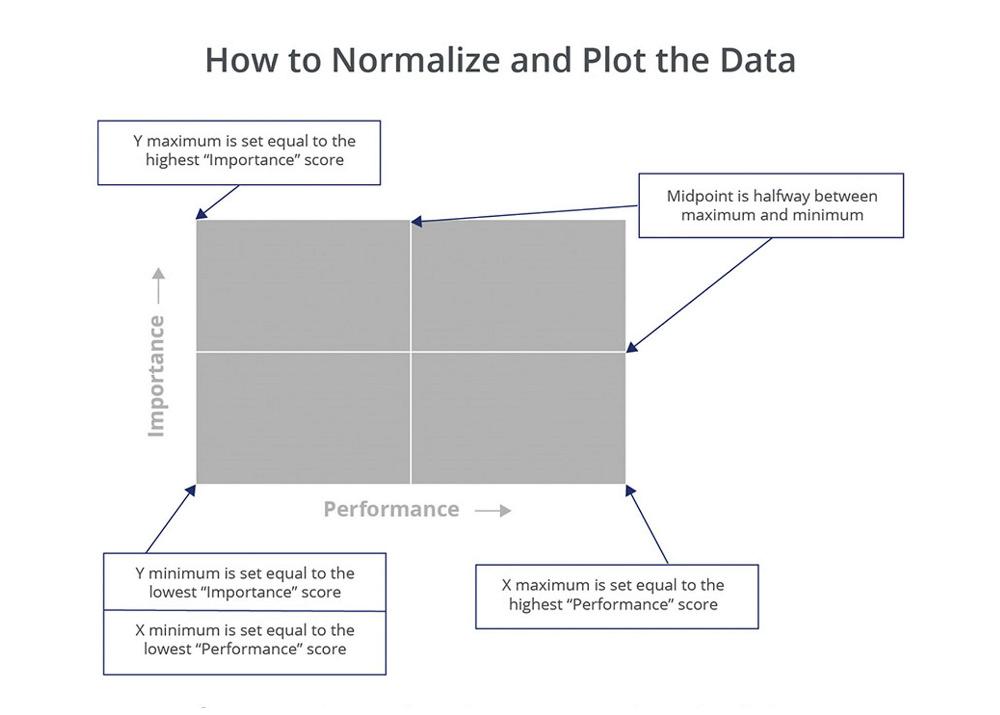
To place the needs into quadrants, normalize the data so it plots correctly on a 2 by 2 grid (Figure 4). To normalize the data, make the Y axis min and max equal the smallest and largest average number of any importance rating, respectively. Repeat this for the performance ratings on the X axis. If you have 25 primary needs, you will plot 25 points on Figure 4, delivering the results in Figure 5. With the needs plotted, add in the two lines to divide the quadrants. For example, the numbers 8, 9, 8, and 3 have a max of 9, min of 3, and a midpoint (not average) of 6. For assistance, download the template titled “Graphing the Marketing Opportunity Map.”
Figure 5 shows the results of plotting the average value for each of the 12 to 25 primary needs of ABC Custom Truck Works’ market.
Some needs are on the borderline of moving from one quadrant to another, and other needs rank very low in importance. Both results are normal and acceptable. In the example, ABC Custom Truck Works should not disregard the “User-Friendly Cabin” need simply because it rated the lowest in importance. All primary needs are important. Perhaps 10 percent of potential customers in ABC’s market won’t buy a vehicle if it doesn’t have a topnotch, user-friendly cabin. The Market Opportunity Map simply shows how needs relate to each other.
The plotted version of Figure 5 typically is not shared with anyone outside the VOC research team. It’s better to show the data represented as shown in Figure 3 to your company departments.
ABC’s completed Primary Needs Table (Figure 2) and Market Opportunity Map (Figure 3) present a clear picture of target market needs and priorities. If appropriate, they can complement this research with ethnography. When applied to marketing, ethnography pertains to observing how customers use a product or service.
ABC now is armed with believable customer needs data that can be used by many departments to significantly improve their business performance. The company should consider repeating this formal research every three to four years. With the VOC process completed, ABC’s research team prints copies and presents the findings to the organization, inspiring a spirit of continuous improvement.
With the powerful VOC research results in hand, your company can move forward with full confidence.


The Fabricator is North America's leading magazine for the metal forming and fabricating industry. The magazine delivers the news, technical articles, and case histories that enable fabricators to do their jobs more efficiently. The Fabricator has served the industry since 1970.
start your free subscription
Easily access valuable industry resources now with full access to the digital edition of The Fabricator.

Easily access valuable industry resources now with full access to the digital edition of The Welder.

Easily access valuable industry resources now with full access to the digital edition of The Tube and Pipe Journal.

Easily access valuable industry resources now with full access to the digital edition of The Fabricator en Español.
In this episode of The Fabricator Podcast, Caleb Chamberlain, co-founder and CEO of OSH Cut, discusses his company’s...


