


Senior Editor

What spells success in fabrication? It’s difficult to answer, but managers can start by measuring and monitoring 12 key metrics. Getty Images
The custom metal fabrication business is more complex than it looks. I mean, it’s just sheet metal, right? But fabricators add a lot of value to that sheet metal, and they do so for dozens, hundreds, sometimes thousands of different customers over a period of days, weeks, or months.
Strategic sequencing and grouping of jobs can decrease costs through setup savings (using, say, a standard tool setup on the punch or press brake) and material yield (through tighter nesting). But if produced to stock (instead of on demand), those jobs could decrease inventory turnover and hinder cash flow. Excessive days in accounts receivable (AR) also hinders cash flow. So can material costs, particularly in a world of highly variable pricing, as the industry experienced during the past two years.
Alas, no one metric in metal fabrication spells success. But select a group of them and monitor them diligently and managers and employees alike can have a good idea where the business stands. They then know which opportunities to tackle and when, and they can correct problems before they snowball out of control.
This has been the goal of the “Financial Ratios & Operational Benchmarking Survey,” an annual report published by the Fabricators & Manufacturers Association International (FMA). The survey sample is small, between 40 and 60 shops from across the country, but each respondent delves deep into their financial statements, revealing (anonymously, of course) more than 30 financial metrics and operational benchmarks. These include sales growth; gross profits; quote-to-win ratios; on-time delivery; gross margins; and their earnings before interest, taxes, depreciation, and amortization (EBITDA)—that is, the money left over for rewarding stakeholders and reinvesting in the business.
In late October FMA presented a webinar hosted by Steve Zerio, an FMA member who has more than 30 years of experience on the financial side of midsized manufacturing companies. Today he’s chief financial officer at Tooling Tech Group in Novi, Mich. During that webinar, Zerio discussed 12 key metrics from the survey that, taken together, can paint a picture of the business’s health, now and in the future.
First, a few disclaimers. The 2019 survey covers financial statements from 2018—a strong year for many and, for some, quite different from current business conditions, considering manufacturing’s overall slowdown during the latter half of this year.
The participants, many of them members of FMA, represent successful organizations. “These are very well-run companies,” Zerio said. “They’ve done very well during the past few years, and they’re likely doing better than their competitors.”
Also, averages for some metrics come from a wide range of responses, reflecting the diverse business models in the metal fabrication arena. A quick-turn piece-part sheet metal fabricator will have a different quote win ratio than a heavy industrial fabricator that focuses on large projects. The averages still are telling, though, especially when you look at how they change from year to year.
Metrics covered in the survey can be tied to the financial cycle that occurs with every business transaction. A sale for an order produces revenue; the efficiency of the operations produces margins; those margins produce net income, which produces the cash flow that feeds the balance sheet.
The revenue-operations-net income portion of the cycle reflects business activity. Zerio described these as being like one’s diet, exercise, and other activities. The cash flow and balance sheet portion of the cycle (the financial ratios) is the result of that activity, like taking one’s vitals at the doctor. Those vitals dictate the activity (exercise, diet) one does to maintain or improve them. If a shop never measures these financial ratios (or “takes its vitals”), it’s running blind.
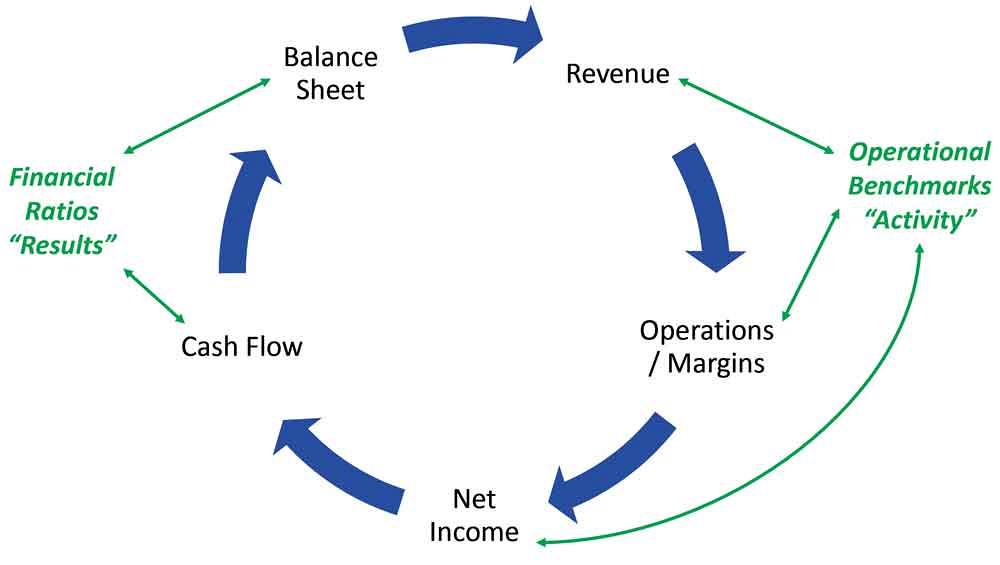
The financial cycle can be a virtuous cycle if it’s monitored and acted upon, a vicious cycle if it’s ignored.
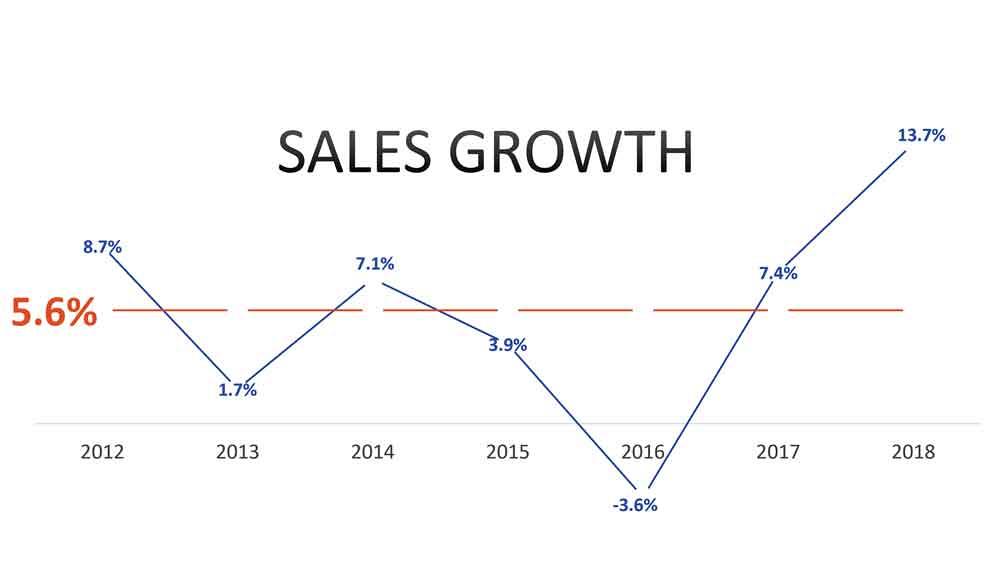
1. Sales growth. [2018 sales – 2017 sales/2017 sales] Among survey participants, year-to-year sales growth averaged 5 percent between 2012 and 2018. The average jumped from a low of -3.6 percent in 2016 (reflecting the slowdown in oil and gas and other areas) to a high point of 13.7 percent in 2018.
“If you have healthy sales growth, identify where it’s coming from, and separate that growth by customers or product type,” Zerio said. “Likely, you’ll have parts of your company that are declining. You should be aware of your declining business, even if it’s offset by positive growth in another segment.”
Doing this helps separate out successes from challenges and gets everyone asking the right questions. Are the challenges occurring because of declining market conditions, or is a competitor grabbing market share? If it’s both, which reason is dominant? Is a competitor grabbing market share with “unsophisticated” pricing (hinting that the work eventually will come back)? Or are competitors offering something you aren’t, like quicker delivery or more value engineering?
Regarding those successful jobs, why are they so successful? Is it worth pursuing more market share? And could success in that sector open doors in others?
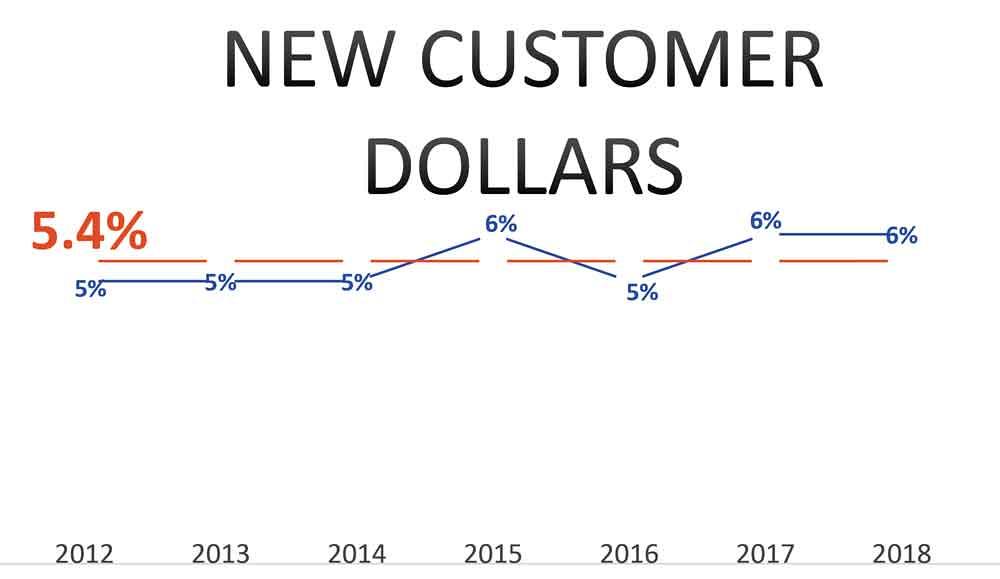
2. New customer dollars. [Dollars from customers added/Total sales] Tracking new customer dollars as a percentage of sales shows the effectiveness of sales and marketing. Survey respondents’ new customer dollars have a long-term average of 6 percent. It’s a key metric for an industry that has historically had high revenue concentration. “A lot of companies have a core customer base between five to eight customers,” Zerio said.
Most fabricators have that “long tail” of dozens or hundreds of other customers. But for the typical shop, a handful of large customers make up the lion’s share of revenue. This is why tracking new customer dollars matters, especially from a historical perspective. How did a new customer turn into a major customer, and how was the work attained in the first place?
“It’s helpful to work backward,” Zerio said, “to find how they became a customer. Was it a specific tradeshow, a personal contact, or a cold call by one of your salespeople?”
As the saying goes, history repeats itself. If a fabricator has had success with a particular kind of customer in a particular kind of industry, could it achieve the same success with a similar customer in another industry?
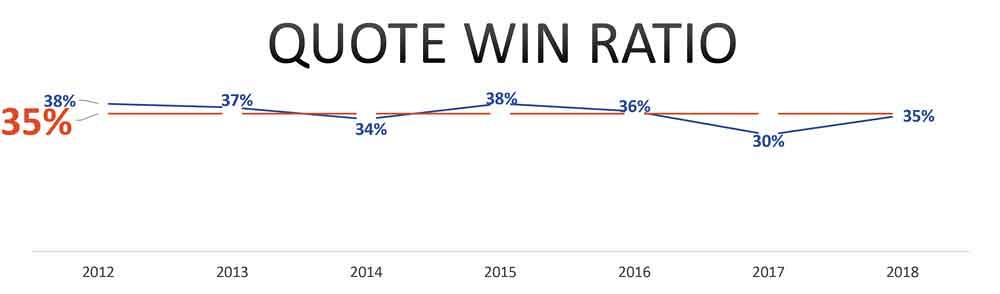
3. Quote win ratio. [Total jobs won/Total jobs bid] Also called the capture rate, the win-to-bid ratio average since 2012 among survey respondents is 35 percent, though the range varies widely, depending on the fabricator’s niche. Even so, Zerio said that when a shop calculates its own win-to-bid average, it provides a good benchmark that can guide a shop’s sales and estimating efforts.
“This is a good opportunity to go granular and calculate the win-to-bid ratio for certain customers and types of jobs,” Zerio said. A certain product or job type might have a very low capture rate, “and yet you might find that you’re still putting a lot of effort into those jobs.” Is it worth it? That depends, but knowing the win-to-bid rate spurs people to ask the question.
Jobs with very high capture rates are also worth noting. “Here, you might look for pricing opportunities,” Zerio said. “If you see you have a 100 percent capture rate on a certain product, it’s good to understand who you’re bidding against and why you’re so successful.”
A very high win ratio also can show a fabricator’s reliance on its core customer base. If salespeople start bidding on more new work outside of the shop’s core niche, the win ratio might decrease—which, considering the effort is for customer diversification, might not be a bad thing.
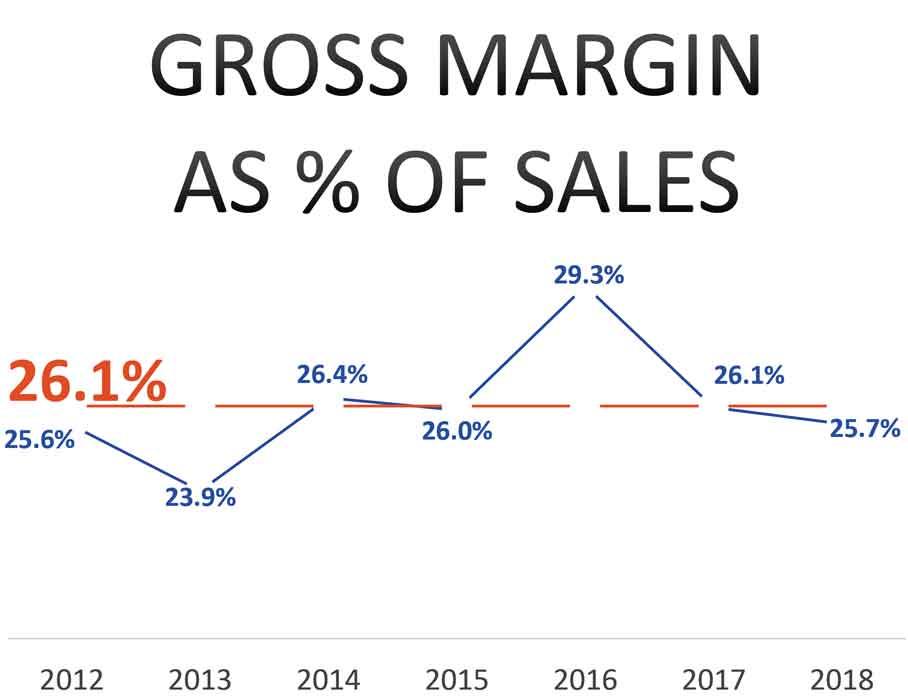
4. Gross margins. [Total sales – Total cost of goods sold/Total Sales] The average from survey respondents declined in 2018 to 25.7 percent, down from a high of 29.3 percent in 2016. The long-term average is 26 percent.
As Zerio explained, two factors drive gross margins: market pricing and a company’s internal cost structure. When it comes to market pricing, it’s not unusual to see gross margins decrease as sales growth increases. Margins for new customers often start lower.
Overcapacity in a local market might play a role too—a common challenge as shops transition to newer and more productive technologies like fiber lasers. Of course, this doesn’t mean a shop should avoid buying new equipment. If it doesn’t have the equipment to compete, a shop could lose out on market share altogether.
That said, analyzing gross profit margins helps measure the effectiveness of equipment investments. “If you buy an expensive new machine, you could have a ramp-up in sales growth,” Zerio said, “but ideally, you should also see an improvement in margins. If you don’t, you should look at the manufacturing processes the product goes through.”
Sure, margins might not increase as much as expected due to outside market pressure, but that might not be the sole culprit. If a fabricator buys a fiber laser and increases cutting capacity yet buries downstream processes with WIP, it might not ship more products in less time using current resources. In fact, the chaos created by excess WIP could cause delivery problems and a host of other issues, including the next benchmarking metric on Zerio’s list.
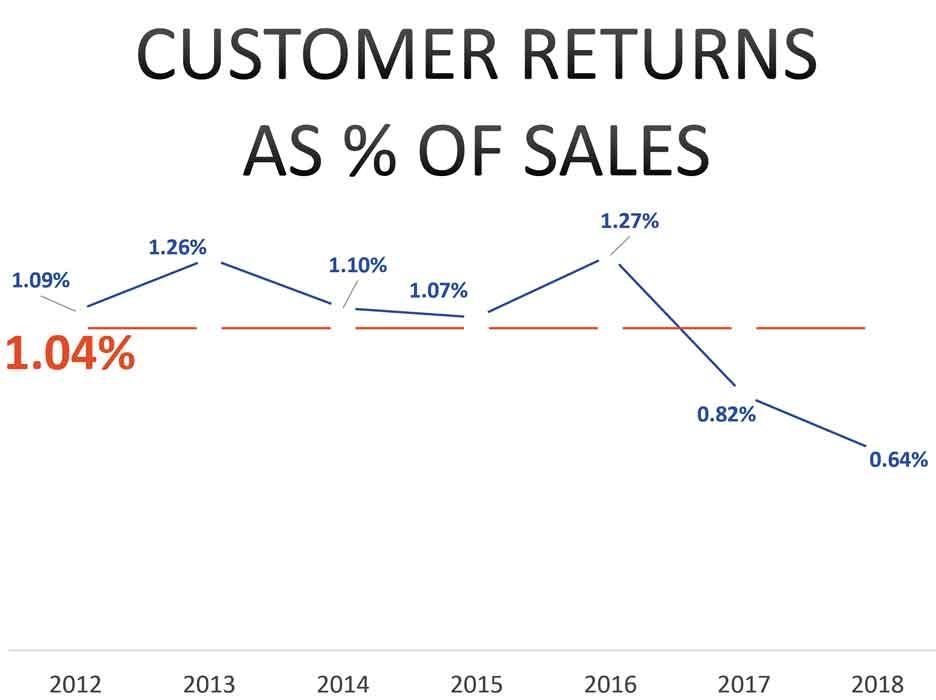
5. Customer returns as a percentage of sales. [Customer returns/Total sales] “This is an incredibly important metric,” Zerio said, “because for a lot of companies, it’s just the tip of the iceberg.” The survey asked respondents for the value of those returns, which is the credit the fabricator gives back to customers. “But many times the real cost of return from customers is two to 10 times the cost of the return itself, especially if you take good care of that customer.”
These implicit costs vary depending on the type of return. Costs might be low for stocked parts—if, say, the customer purchased the wrong size and it’s just a simple matter of restocking the return and sending the correct part. But a returned custom part is another story. A customer return requires the fabricator to scrap the product and eat the cost, both time and material, for making another product.
“Then there’s the goodwill that can be lost with that customer,” Zerio said, “as well as future customers.”
The trend among survey respondents has been very positive. Since 2012 average customer returns as a percentage of sales has dropped almost 50 percent. In 2018 it was just 0.64 percent of sales.
Still, no matter how low the average level of returns, Zerio said that a fabricator should identify customers and job types for which customer returns are highest, then institute corrective actions. “How did these returns occur? Chart them, and determine whether it’s from a certain process, certain department, or certain employees. Then hold managers accountable for improving them.”
Zerio added that “this shouldn’t be an invisible process. Employees and managers should see these returns and know how they occurred.”
If the returns persist, then from that customer’s point of view, “your shop is relegated to bottom-feeder status in the industry.”
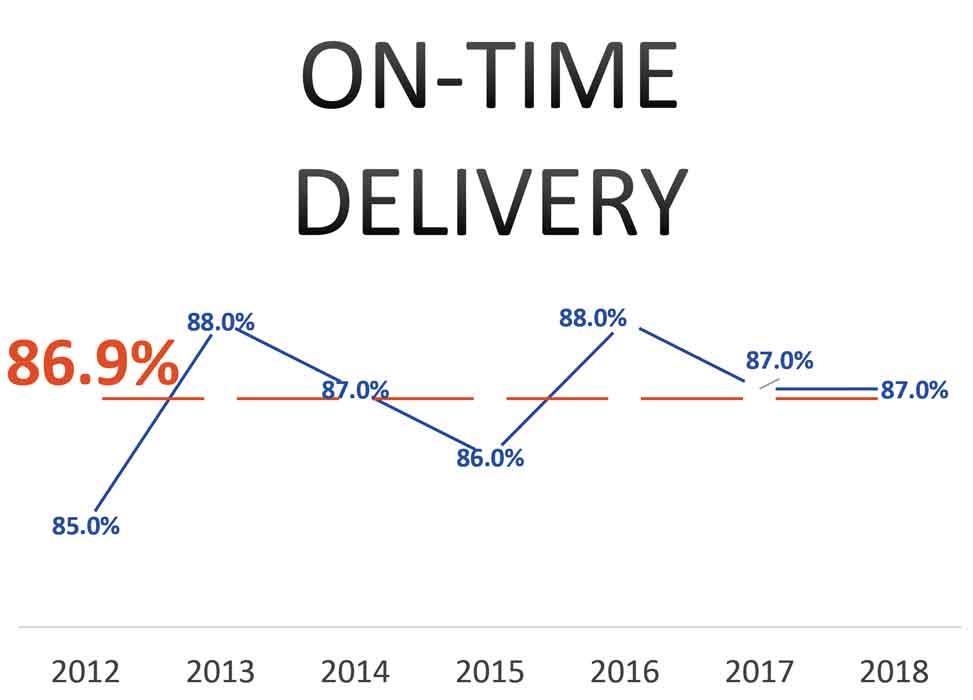
6. On-time delivery. [Orders delivered on time/Total orders shipped] “This can really affect gross margins in a lot of shops,” Zerio said. For survey respondents, on-time delivery over the past five years has averaged 87 percent.
“Sometimes 87 percent meets customer expectations fully, and if that’s the way your business works, that’s fine,” Zerio said, adding that some “late” orders might not be truly late if they simply sit on a shelf as part of a customer’s inventory buffer, so an order that’s a day late might not disrupt production. “But if 87 percent represents orders that you’re truly late on, then you have an issue that needs to be addressed, and it’s just as important as customer returns.” Late deliveries not only shrink margins, but also, like customer returns, damage a fabricator’s reputation and stunt future growth.
“Take a look at the underlying data. What are these late deliveries, and what caused them?”
Some might point fingers at the final operations in production, but quite often the issue can be found upstream, like in estimating and engineering. It might have taken forever to get clarification on a print detail, yet to honor its initial promises, the shop still commits to the original deadline and expedites the order, creating a shop floor traffic jam that pushes other orders behind schedule. And the challenges continue to snowball.
The problem might have to do with flexibility and the shop’s desire to maintain one or two shifts, considering how difficult staffing a third shift can be in a tight labor market. “In these cases, I’ve seen success with shops with flexible hours,” Zerio said. “If you can get a group in a few hours earlier or another group to stay a few hours later, you might be able to get 25 percent more production during the day.” This could prevent having to add a third shift or opening the shop Saturday and Sunday to work through the backlog.
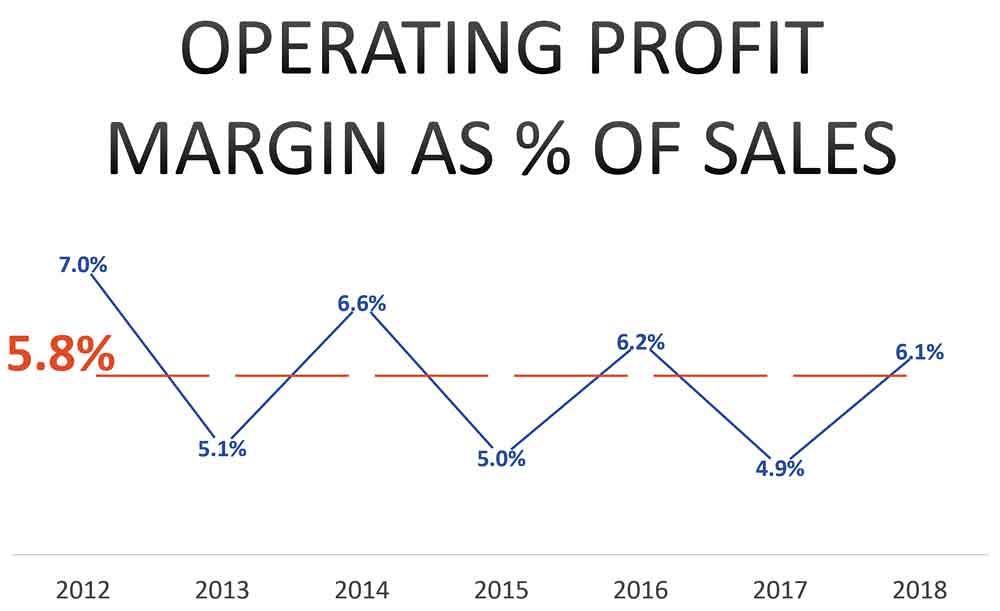
7. Operating profit margin. [(Total sales – Total cost of goods sold – Total SG&A)/Total sales] This has averaged just shy of 6 percent over the past seven years of surveys, though it’s varied year to year by a percentage point or more.
Gross margins usually have the greatest impact on operating margin, but Zerio included it among his key metrics because it can reveal challenges with a company’s sales, general, and administrative (SG&A) expenses. If gross margins improve and yet operating margins do not, rising SG&A is to blame.
“If this is the case, you want to look at cost overruns in your SG&A,” Zerio said.
Accounting departments can put employee health care costs into SG&A. Health care’s an important benefit, and reducing these benefits might not be an option, considering the tight labor market and the implicit costs of higher employee turnover.
But SG&A involves other expenses, including (of course) sales and administration. For instance, a fabricator might hire several managers to increase sales and operational efficiency, and in the short term SG&A might increase more than gross profits, but this shouldn’t happen indefinitely.
“Take a good look at your SG&A spending,” Zerio said. “See the opportunities for growth, develop a plan, and then monitor it monthly, comparing the planned results to actual results. This should help drive up your operating profit margin.”
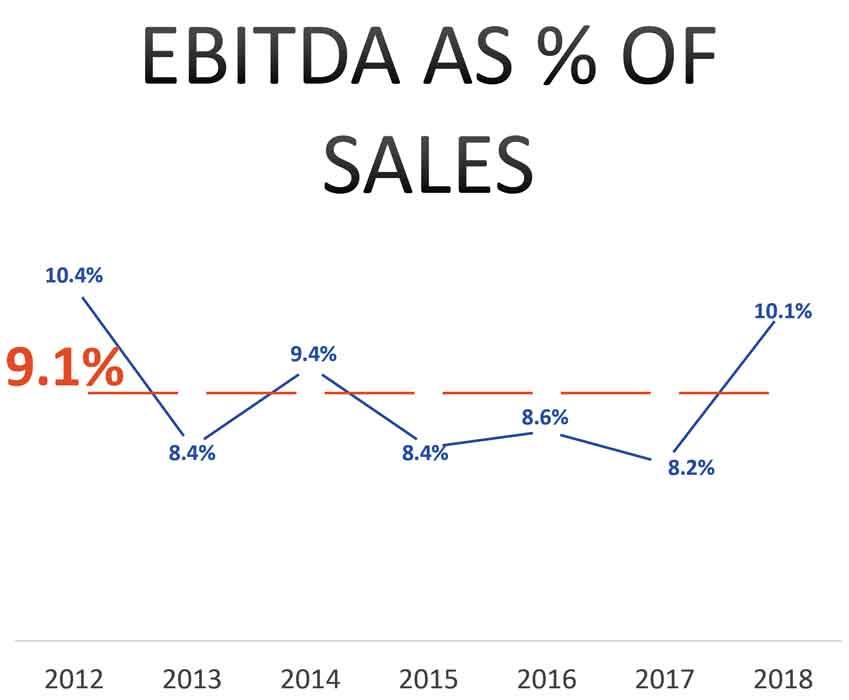
8. EBITDA margin. [(Net income + Interest expense + Income taxes + Depreciation expenses + Amortization)/Sales] “This essentially is the cash flow of the business generated to buy capital equipment or pay down debt,” Zerio said. “It’s incoming cash to the company that’s adjusted up or down a bit, depending on the payables and receivables. It’s a very cumulative measure of all metrics, and it’s one that needs to be tracked, especially by senior management.”
A company with a strong EBITDA margin essentially has more money to work with. If employees see a shiny new laser or robotic press brake on the floor, they should realize that it came thanks to the shop’s strong EBITDA performance, increasing available cash and the company’s ability to borrow. And among survey respondents, 2018 was a very good year for EBITDA margin, reporting an average of 10.1 percent. The seven-year average is 9 percent.
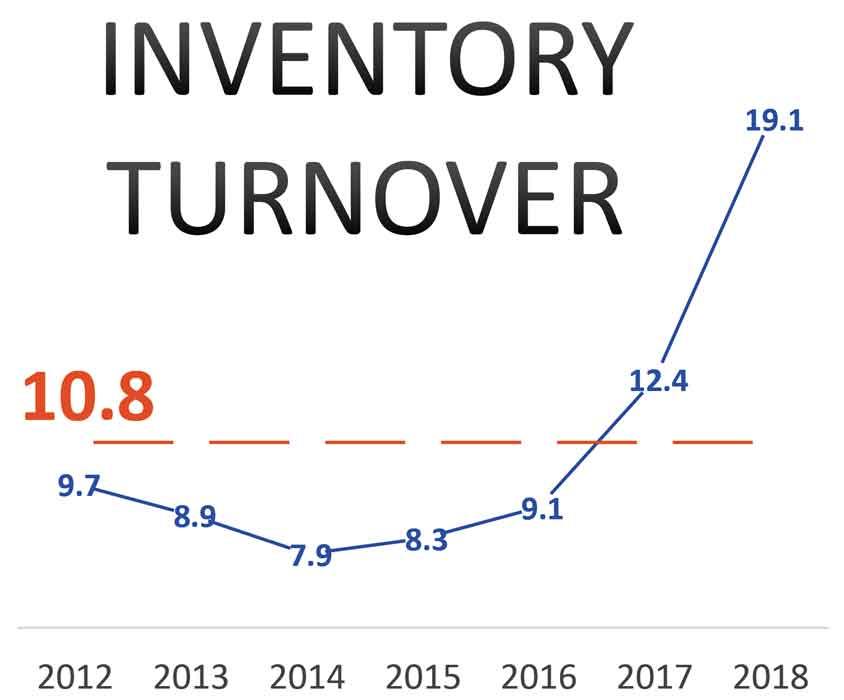
9. Inventory turns. [Annual cost of goods sold/Average dollar value of inventory] In some ways this metric bridges the gap between operational metrics that produce net income—the “activity” side of the business cycle—and the balance sheet side showing the results of those activities. The long-turn average for survey respondents has been a little less than 12. “This means each month virtually all the inventory on the floor gets shipped,” Zerio said.
“During the past two years we’ve seen some incredible success here, with the 2018 average coming in at 19.1. This becomes key not only for turning inventory into cash, which is a wonderful thing, but it gives you the ability to take on additional work efficiently. In effect, it allows you to take on more sales with the same resources.”
Individual inventory turns might vary, depending on a fabricator’s niche and operating and inventory strategy when it comes to raw and finished stock. But however many turns a fabricator has, achieving a higher number usually reflects a positive trend.
If inventory turns decrease, what can a manager do? “Don’t just rely on reports,” Zerio said. “Walk the floor with a different set of eyes. Often we walk the floor to the shipping area with ‘delivery eyes.’ Sometimes we walk the floor with ‘safety eyes,’ looking for proper protective equipment and safe practices. And sometimes we look with ‘inventory eyes,’ watching for inventory that might be stuffed into some corner.”
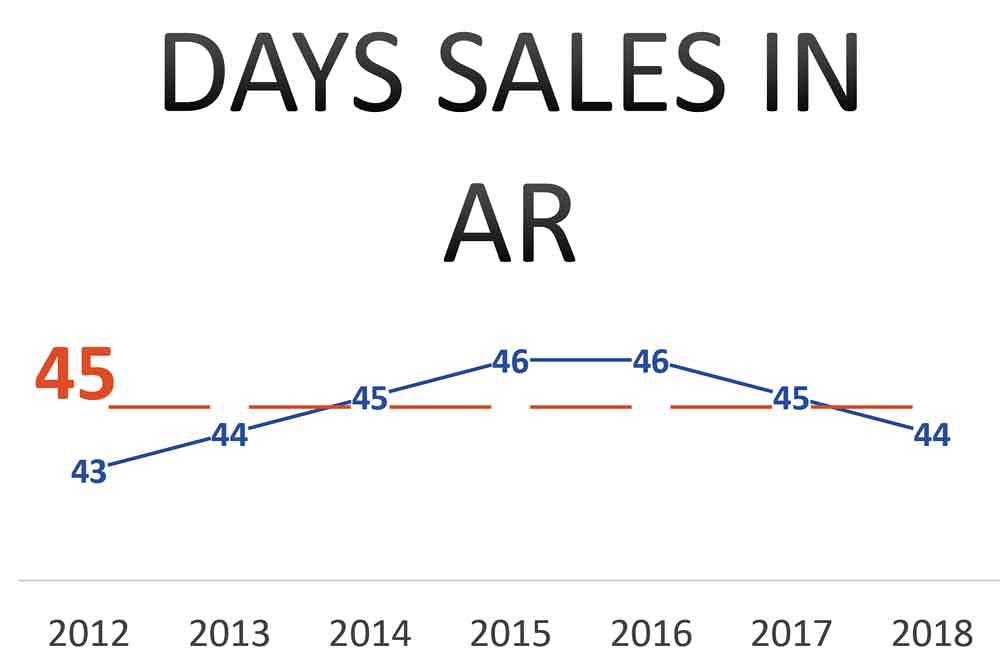
10. Days in accounts receivables. [Month-end AR/Monthly sales × 30] Average days in AR for 2018 was 44 days, “and that’s a good trend,” Zerio said. “It’s a moderate improvement over past years.”
If AR days grow, what can a shop do? “Work with the controller and sales manager, and make sure that the sales team knows about the payment delays from certain customers, as well as other collections concerns,” Zerio said.
There’s the old saying among credit managers and controllers: It’s not a sale until we’re paid. The job might look perfect on paper; it might be right in the fabricator’s operational sweet spot. But if the customer treats the fabricator as a bank, well, that work might not be so perfect after all.
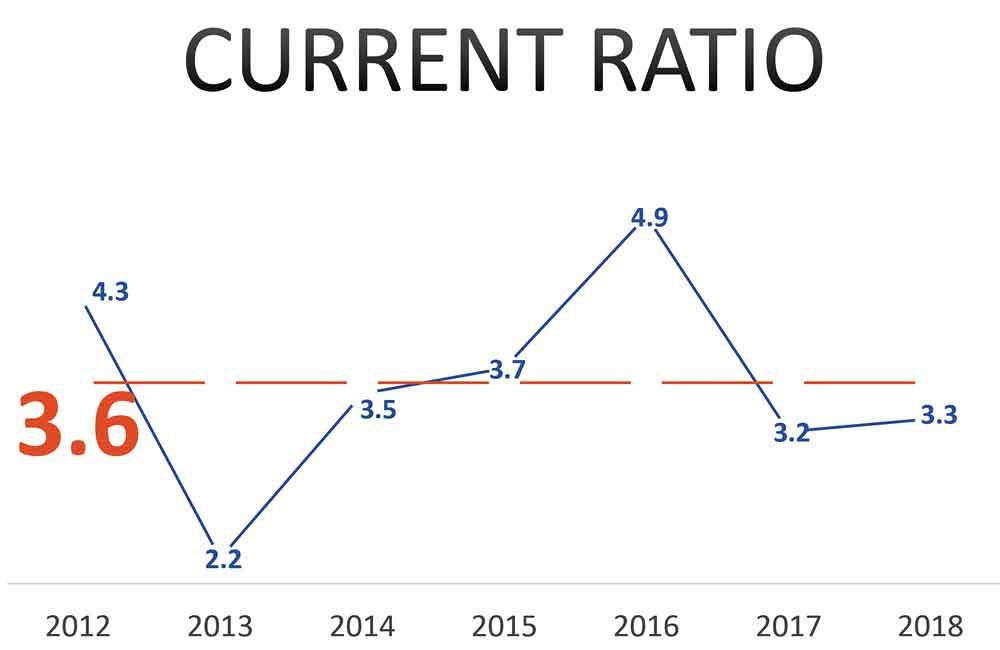
11. Current ratio. [Total current assets/Total current liabilities] A traditional balance sheet metric, this compares assets to liabilities. The long-term average among respondents has been 3.6, meaning shops have more than three and a half times more assets than liabilities.
“This shows that participants are financially conservative and do a good job managing their balance sheet,” Zerio said. “Regardless, if your current ratio is trending lower, you need to look at your inventory and receivables carefully. More than other ratios from the balance sheet, the current ratio is driven by operational results.”
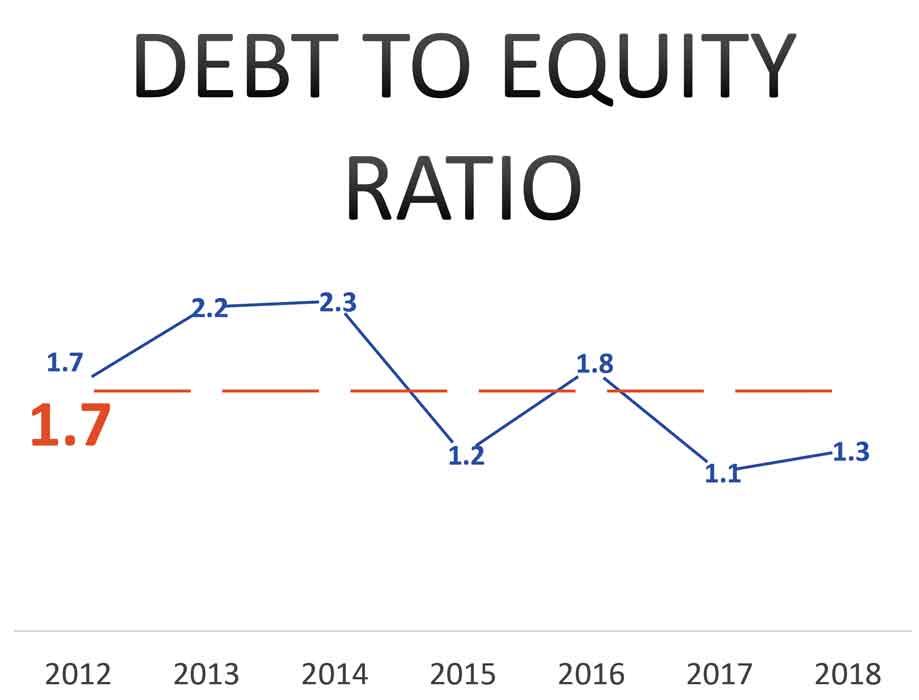
12. Debt-to-equity ratio. [Total debt/Total equity] This compares a company’s overall debt to equity. The long-term trend in the survey has been 1.7. As Zerio explained, “2 is a generally acceptable debt-to-equity ratio, but it depends on the size of the company and the risks you’re taking.
“Of course, the ratio will jump a bit when you buy a nice new machine and take on some debt to buy it,” Zerio continued. “Your debt will spike for a few months, but if you plan for it and monitor it, and know exactly what you’re comfortable with, a temporarily higher ratio can be a good thing.”
To monitor metrics, Zerio suggested using a monthly scorecard detailing the champion of each metric (operations manager, controller, etc.), the stated goal for the month, and the variance.
Zerio emphasized that these aren’t the only metrics a fabricator might choose to measure. The annual survey covers numerous others, including direct and indirect labor as a percentage of sales, material costs as a percentage of sales, and value-added per payroll dollar (sales minus material costs divided by the total payroll expense). For many operations though, these 12 get to the heart of the financial cycle, with a healthy balance sheet providing ammunition for sales and operations to produce net income—and, in turn, make the balance sheet stronger.
FMA’s complete “2019 Financial Ratios & Operational Benchmarking Survey” is available at the FMA store. To view an archived version of the webinar, visit fmanet.org/training/fabcasts.


The Fabricator is North America's leading magazine for the metal forming and fabricating industry. The magazine delivers the news, technical articles, and case histories that enable fabricators to do their jobs more efficiently. The Fabricator has served the industry since 1970.
start your free subscription
Easily access valuable industry resources now with full access to the digital edition of The Fabricator.

Easily access valuable industry resources now with full access to the digital edition of The Welder.

Easily access valuable industry resources now with full access to the digital edition of The Tube and Pipe Journal.

Easily access valuable industry resources now with full access to the digital edition of The Fabricator en Español.
In this episode of The Fabricator Podcast, Caleb Chamberlain, co-founder and CEO of OSH Cut, discusses his company’s...


