


Principal

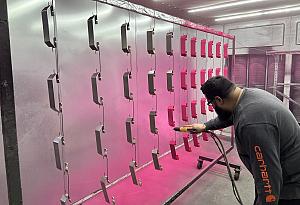
The spoken word can be powerful but also misunderstood. Visual tools help minimize the confusion, especially when striving for continuous improvement in a manufacturing facility. Getty Images
A picture is worth a thousand words, and in process improvement, no truer words have been spoken. Visuals play a special role in your lean journey. Presenting information in a visual way helps sharpen your analysis and deepen a shared understanding of the targeted subject or topic.
When relying on verbal communication, two people can simply talk over each other and assume they understand each other. They think they communicated a point when in reality they have a complete misunderstanding.
Think about the last time you discussed a process with someone. Perhaps you and your boss talked about a new workflow for a product launch. Maybe you and your improvement team colleague talked about investigating a root cause for the problem of the day. You might have talked with sales and engineering executives about the excessive time between customer order initiation and order fulfillment. When any of these interactions lack visual support such as a flowchart, a value stream map, a chart showing trendlines, or a photo of the actual occurrence, you run the risk of misunderstanding. With misunderstanding comes disruption, expenditure of scarce resources, and drama that is simply unnecessary.
Some processes are tangible, others intangible. Making a welded assembly is tangible. You can see the material flow through laser cutting, bending, welding, and packaging. You can count the pieces, see the defects, and observe the movement from one operation to the next. Such a process produces physical pieces that provide some level of clarity.
But what about informational and transactional processes? Your manufacturing business is full of them, and it’s easy to underestimate their impact. Compared to physical processes, they aren’t as much fun to investigate, understand, and improve. Going to gemba, an important lean manufacturing tool, means you “go see” where the value is taking place. You can go see a welded assembly process, but you’ll find it much more difficult to “go see” quoting, engineering change orders, or nonconformance reporting. These processes move information and execute transactions. Comparatively, you experience little instant gratification, which tends to enable the focus to drift.
One of the most powerful tools when dealing with these intangible processes is the flowchart or process map. Each gives you a picture of the intangible work. Think about the last time you held a meeting to discuss an intangible process, be it quoting or anything else. If you simply talked with no visual support, did you sense differences in understanding? Were people confused about what was or wasn’t happening to the work? Or did you sense animosity as colleagues dug in their heels to defend what they knew to be right?
By having a flowchart or process map or creating one during the meeting, you have a tool that defines the flow of work and allows anyone to point to a specific process step—and you can be confident everyone is focused on that same step. Such tools help the group move quickly toward constructive analysis and potential consensus. And if you have graphs that clearly present the process variables (volumes, types, relative occurrences), you minimize the unnecessary emotion and drama.
Consider the impact of informational and transactional processes in your business. How much time do you spend troubleshooting and improving them? Using visuals will help make you a more effective problem-solver and process-improver.
The tangible processes you perform to make products have many moving, interconnected parts: materials, supplies, tools, jigs, fixtures, and more. These tangible processes create a system represented and supported by the various functions within your company. Each function tends to look at the system through its own unique lens. When people take this narrow perspective too far, though, you end up with silos—not a good thing.
Visuals help widen this narrow focus. When you show people a process map that clearly illustrates the flow, a spaghetti diagram showing the movement of product and people through a work center, or a bell-shaped curve to make the point about standard deviation in a normally distributed set of data, what happens? Everyone at the meeting, people from different places within the company, sees the same big picture. In doing so, they see how their contribution fits in with the contributions of others.
Say you and your project team must define a layout for a new production line. This is clearly about how the facility, machines, fixtures, tools, material, and people interact efficiently and effectively to produce the product. Team members will share different perspectives: the production department getting the parts out on time; the materials department getting the components to the right place at the right time in the right quantity; the quality department having the space to perform checks and inspections; maintenance having the clearances to access elements of the machine; and engineering working on process streamlining and improvement. All this has to be done such that the new process is safe for everyone and preferably aligns with the lean ideas you have learned about during your lean journey.
To make the most of your team’s work sessions, define and visually present your design principles. You could simply write those principles in large letters on a flipchart page posted on the workroom wall—there for everybody to see, front and center, in your face. Displaying those principles in this way helps keep the team true to its purpose.
The 2D (or 3D, if you have the right software) layout diagrams create a picture of the process and the work environment. In the beginning of your layout efforts, you use sticky notes so that you have maximum flexibility. Share the markers and sticky notes so that every team member can contribute to the whiteboard.
As you develop the layout, the team highlights issues that emerge. One team member finds a significant clearance constraint. Another uncovers a drop-zone sizing problem for incoming and outgoing material. Someone else identifies non-value-adding movements of a production employee performing tasks in an area (a micro-level issue). Others uncover the crisscrossing and backtracking of product conveyance in an order’s overall trip through the factory (a macro-level issue). The visual layout provides clarity to all the functions represented, even though each has its own view of what is required.
The team identifies operational data relevant to the new process and makes that data clearly visible to anyone developing and evaluating the layout. Basic data points include takt times; cycle times; optimal staffing levels; and container sizing for pitch, or the amount of time it takes to fill a container, move it downstream, and retrieve another container to keep producing. If all these data points are made visual, every team member will be on the same page when they make decisions about space, work placement, equipment, and staffing.
Using visual tools might seem excessive at times, especially when only a few basic numbers drive the shop layout design. Failing to make the data visual, however, raises the risk of miscommunication. What if one person believes the correct operational data is different than the next person? And we wonder why it seems so hard to come to consensus.
These examples just scratch the surface of the kinds of visual presentations you can use. You might rely on a simple whiteboard or flipchart, use graphs and charts from Excel, or capture a video on your smartphone. You have many ways to be creative; just be sure to use what works for your organization.
Effective use of visuals can help accelerate the arrival of the aha! moment when the light bulb turns on and the idea clicks. Have you been in a situation where you struggled to understand what someone was explaining to you? Try as you might, you just didn’t get it. But finally it became clear. That is the aha! moment.
The next time you try to explain an idea about a process, be it intangible or tangible, use one or more of the visual tools to make your points and reduce confusion. Help create that aha! moment.


The Fabricator is North America's leading magazine for the metal forming and fabricating industry. The magazine delivers the news, technical articles, and case histories that enable fabricators to do their jobs more efficiently. The Fabricator has served the industry since 1970.
start your free subscription
Easily access valuable industry resources now with full access to the digital edition of The Fabricator.

Easily access valuable industry resources now with full access to the digital edition of The Welder.

Easily access valuable industry resources now with full access to the digital edition of The Tube and Pipe Journal.

Easily access valuable industry resources now with full access to the digital edition of The Fabricator en Español.
In this episode of The Fabricator Podcast, Caleb Chamberlain, co-founder and CEO of OSH Cut, discusses his company’s...