


President
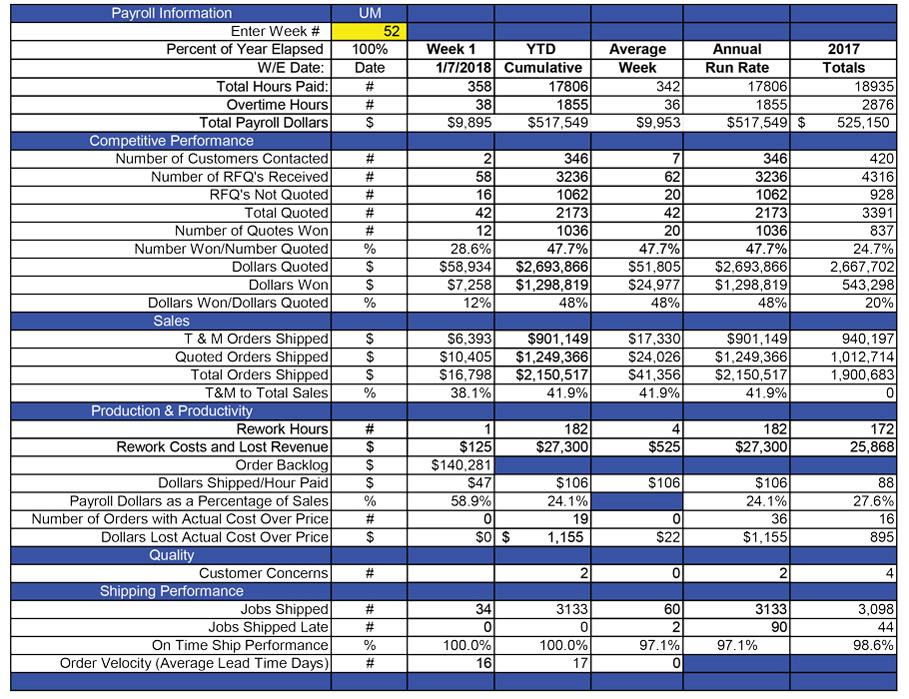
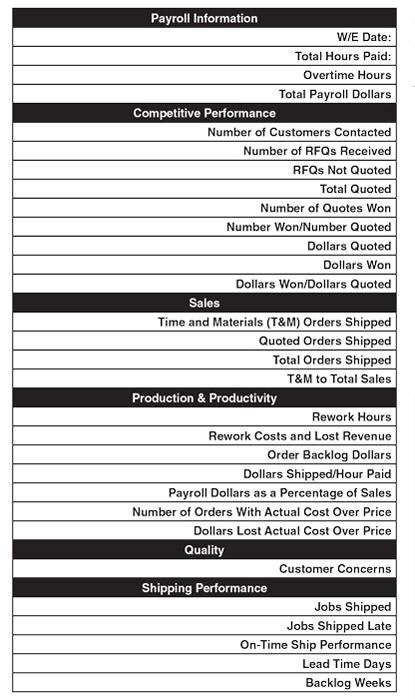
Figure 1
The weekly performance report incorporates key metrics like rework, shipping performance, and dollars shipped per hour.
Does your job shop have a weekly performance report? You could call it a scorecard, weekly management report, key indices report, or something else. What you call it doesn’t matter—it’s what’s in it that counts.
All-inclusive, the report should show the most up-to-date, accurate information on key performance metrics that span the entire business process, from leads generated to orders shipped. This enables managers to see trends; monitor the health of the business more precisely, virtually in real time; and act quickly.
Say something goes awry during the first week of the month. Four weeks later accounting just begins preparing the financial statement for the previous month. Two weeks after that, accounting releases the financial statements—a full six weeks after that initial problem caused performance to suffer. When something in your business goes south, using six-week-old information to detect it puts you behind the eight ball.
The weekly performance report, or WPR, functions as an early warning system. Detecting problems sooner rather than later is better, of course, and the WPR enables you to do just that. It allows you to stay on top of your business and drive continuous improvement at the same time.
Of course, simply publishing metrics is just a piece of the job shop puzzle. For the WPR to be truly effective, other pieces need to be in place.
One piece is a shop’s organizational structure. Traditionally, shops have a functional structure. If you work in a large shop as, say, a laser cutting machine operator, you report to the laser cutting department supervisor, who reports to the shop foreman or production manager, who reports to the vice president of manufacturing, who reports to the senior executive team. If you’re a senior engineer, you might report to the vice president of engineering, who reports to the president.
The functional structure seems natural except for one thing: It doesn’t align with the job shop business process. Put another way, the structure forces orders to flow through a forest of functional silos and organizational boxes—from sales to estimating to purchasing to engineering to manufacturing and shipping. Each silo’s performance might be based on a variety of things, but it’s probably not on how well an order flows through the entire organization, from quotes to cash. And the characteristics of that quote-to-cash cycle—the quality, speed, effective communication, and delivery—are what the customer really cares about.
But what if a job shop changed its organizational chart so it aligns with the job shop business process, which is getting an order, preparing an order, and producing that order? Why not organize a shop around these three basic tasks? The front end (marketing, sales, customer service, estimating, engineering support) focuses on getting the order; preproduction (purchasing, capacity planning, scheduling, tool development, quality protocol development) prepares that order; and production (manufacturing, quality, maintenance, and shipping) produces that order. (To dive deeper into this new concept, check out “A new look at the job shop organization chart” from the March 2019 issue, archived at www.thefabricator.com.) When you view and manage your business as a process, you will be in a much better position to pinpoint areas for improvement, act on them more precisely, and direct continuous improvement.
Typical information in the WPR includes operational numbers, such as the number of orders shipped on time; dollars, like the value of orders shipped during the week; and percentages, such as the percentage of orders shipped on time.
The WPR aligns with the income statement and foreshadows it. The information in the WPR is a leading indicator of the monthly income statement that follows. When a series of good WPRs indicates a healthy business process, healthy financials will follow.
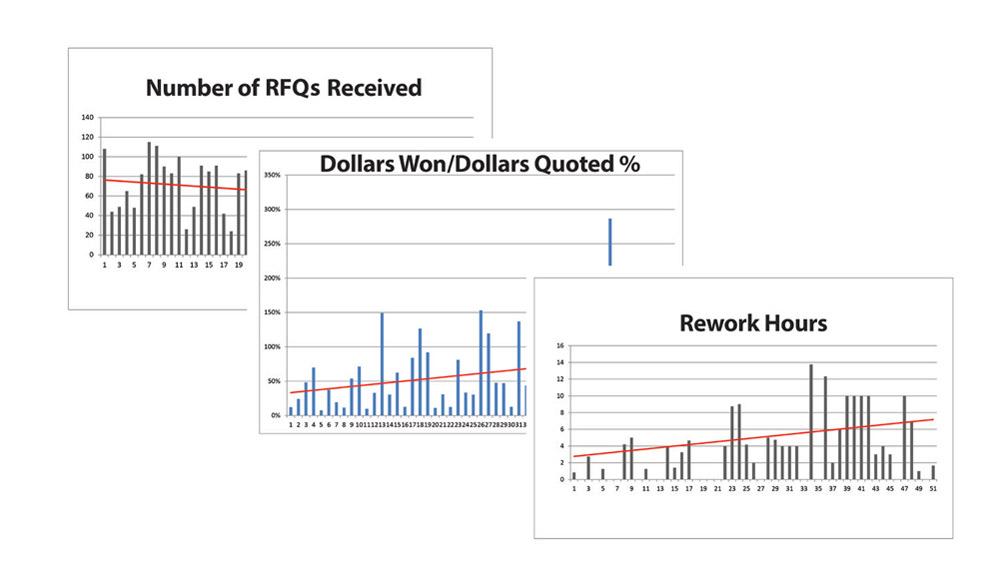
Figure 2
The report’s trend graphs illustrate the progress being made on specific metrics.
The report comprises two parts, a spreadsheet and a set of graphs (see Figures 1 and 2). The spreadsheet captures weekly data on metrics that managers have determined are important to monitor. The graphs show trends over time and are used to monitor and measure continuous improvement. Each metric has its own graph. When data is entered, the worksheet automatically adds another bar to the appropriate graph for that week.
The WPR shows average and cumulative calculations. For example, a WPR for a small job shop in the sixth week of its fiscal year might show $144,000 in year-to-date shipments, with an average weekly dollars shipped of $24,000. From this, the WPR projects year-end revenue based on that average.
The WPR also tracks results as operations improve. So if the shop increases the weekly-dollars-shipped average to $25,000, the WPR projects the increase in year-end revenue. For instance, as shown in Figure 3, revenue would increase from $1,248,000 to $1,300,000.
To construct your WPR, first assemble your key people and talk through what would be important to measure and why. The basic idea is to select those measures that best represent the health of your business. Involving people has a side benefit: You educate them more fully about what is important in the business (see Figure 4). Metrics are not necessarily fixed. Once you have selected the metrics and programmed the spreadsheet, you can implement the WPR as a routine in your organization. It’s less complicated than it looks.
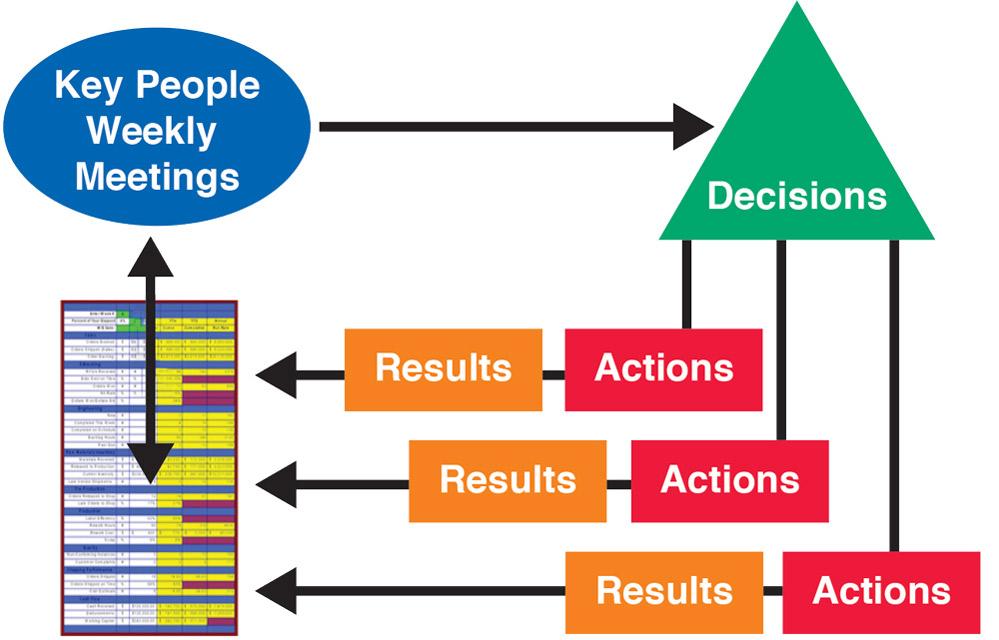
Using the WPR boils down to a five-step weekly cycle:
The WPR shouldn’t be difficult to integrate into your organization. For instance, agents from sales, engineering, preproduction, shipping, and other departments could report weekly numbers on Monday morning, and the report would be released and distributed by lunchtime. Managers meet that afternoon, review the data, and determine a plan of action. Results are reported the following Monday, and the cycle continues.
The discipline of the WPR keeps management focused on the overall business process (see Figure 5). It enables problem-solving before things get out of hand. And it makes performance visible, which has a certain motivational effect on those being measured.
The WPR is not a new idea. It is a well-established tool in both job shops and production shops, although production operations use different metrics. When you make the WPR a routine in your shop, you will manage the process more effectively and ultimately drive significant improvement.
Vincent Bozzone is president of Delta Dynamics Inc., 925 Foster Road, Clarkston, MI 48346, 248-961-1380, vincent.bozzone@gmail.com, jobshop360.com, delatadynamicsinc.com.
The Machine Uptime Misnomer
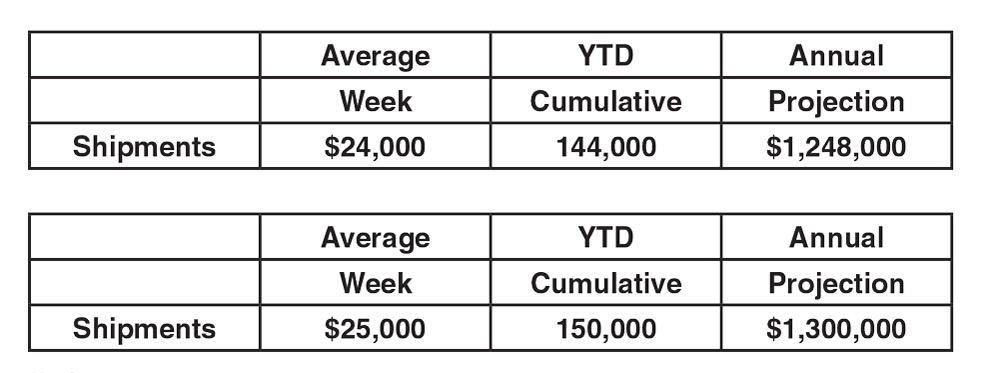
Figure 3
The WPR alters its projections with changes in performance. For instance, if the average weekly value of shipments increases, the year-end revenue projection changes.
The weekly performance report (WPR) is effective only if it includes metrics that measure overall business success. For instance, in a job shop, dollars shipped over a specific time (per hour, per day, etc.) really matters; machine uptime usually does not. Not all machines in a job shop are production machines but are critical to have when they are needed—like, say, a broach or a saw.
Sure, stellar machine uptime can be a sign that you are indeed shipping more parts (dollars) out the door. But what if average machine uptime goes down and average dollars shipped stays steady or even goes up? That might mean you’ve just increased your available capacity, which means you’ve given your shop more to sell. Or it might mean that the orders shipped over a certain period simply had a higher price or higher volumes, or perhaps the orders had unusual routings that sent orders to some machines but not others.
The point is that machine uptime really doesn’t indicate overall business success in a job shop. Of course, poor machine uptime can cause a key metric, like dollars shipped per hour, to go down. If that occurs, the WPR reveals the problem and managers meet to discuss corrective actions, one of which might be streamlining changeover on a machine to keep orders flowing. The machine uptime percentage happens to rise, but the rising dollars shipped per hour is the true measure of success.


The Fabricator is North America's leading magazine for the metal forming and fabricating industry. The magazine delivers the news, technical articles, and case histories that enable fabricators to do their jobs more efficiently. The Fabricator has served the industry since 1970.
start your free subscription
Easily access valuable industry resources now with full access to the digital edition of The Fabricator.

Easily access valuable industry resources now with full access to the digital edition of The Welder.

Easily access valuable industry resources now with full access to the digital edition of The Tube and Pipe Journal.

Easily access valuable industry resources now with full access to the digital edition of The Fabricator en Español.
In this episode of The Fabricator Podcast, Caleb Chamberlain, co-founder and CEO of OSH Cut, discusses his company’s...


