Contributing editor
- FMA
- The Fabricator
- FABTECH
- Canadian Metalworking
Categories
- Additive Manufacturing
- Aluminum Welding
- Arc Welding
- Assembly and Joining
- Automation and Robotics
- Bending and Forming
- Consumables
- Cutting and Weld Prep
- Electric Vehicles
- En Español
- Finishing
- Hydroforming
- Laser Cutting
- Laser Welding
- Machining
- Manufacturing Software
- Materials Handling
- Metals/Materials
- Oxyfuel Cutting
- Plasma Cutting
- Power Tools
- Punching and Other Holemaking
- Roll Forming
- Safety
- Sawing
- Shearing
- Shop Management
- Testing and Measuring
- Tube and Pipe Fabrication
- Tube and Pipe Production
- Waterjet Cutting
Industry Directory
Webcasts
Podcasts
FAB 40
Advertise
Subscribe
Account Login
Search
Lean in heavy fabrication
Improve fabrication and manufacturing throughput with lean visual management
- By Kate Bachman
- September 1, 2019
- Article
- Shop Management
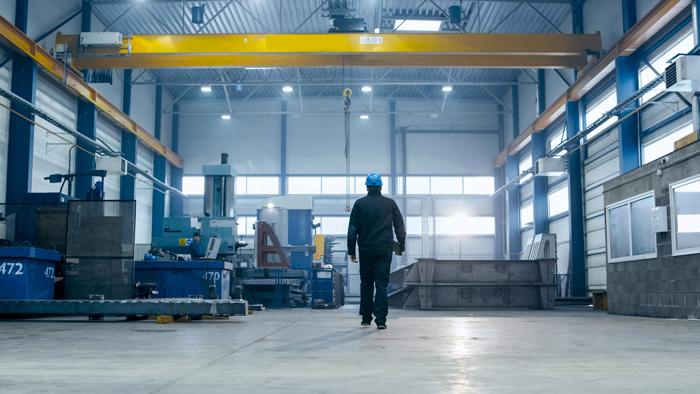
As you walk the plant floor, do you know—at a glance—where your product is and how your operation is doing?
Editor’s Note: This article is based on a course presentation by Keith Leitner of Graduate and Executive Education, Haslam College of Business, University of Tennessee, Knoxville. The course is based on lean concepts (coined in the book The Machine That Changed the World by James Womack, Daniel Jones, and Daniel Roos), and the theory of constraints (based on the book The Goal by Eliyahu M. Goldratt and Jeff Cox).
If you ask people what “lean” is, some will say it is all about eliminating waste. They believe that means cutting costs. It does not. Lean goes beyond cutting waste and costs.
An organization’s main goal is not to cut costs. It is to grow and provide more value for customers. Waste is in the way of doing that. Businesses are never going to cut their way to success. The business perspective is that lean is about growing and removing obstacles to growth.
The best way to do that is to link lean concepts with the theory of constraints philosophy, which is to identify and remove waste that is keeping your company from growing. It’s understanding what’s currently constraining your growth. And that’s all you need to be working on. Once you identify that, the lean tools and techniques can help you alleviate that constraint so that you can get greater throughput.
Lean Tools. Before you can improve any process, you have to map it to understand your current state. Value stream mapping, spaghetti diagrams, and process sequence charts are three lean tools that can help you do that.
The key point is, you can’t manage a process without knowing what’s going on right now.
Why Heavy-fabrication Plants Need Visual Management
Large heavy-fabrication plants must know what’s going on at a glance. They must be able to deploy the power of blink, as discussed by Malcolm Gladwell in his book, Blink.
Because heavy and large fabrications usually are complex jobs that are performed in huge plants over a longer period of time than small, thin-gauge fabrications, it is often more difficult for management to know what is going on at all times. At the same time, it is also more important than ever for management, and in fact everyone involved, to know the status of each operation at all times.
If you read yesterday’s production report, does it tell you what’s going on right now? No.

Visual cues should be easily understandable, simple, continuously updated, and accessible. They should be clear signs that indicate what’s going on.
Visual Management, Explained
Greek philosopher Heraclitus of Ephesus, born in 544 B.C., said, “No man ever steps in the same river twice, for it is not the same river and he is not the same man.”
If you describe a river by standing on its banks, you’re wasting your time, because the river you’re describing is gone and new water is replacing it. You cannot step twice in the same river, for the waters are ever flowing.
It’s a mistake to assume that the new river’s going to be like the old one. If you really want to know what’s happening in the river, put your foot into it and describe what’s happening to your foot. Then it’s very real at that point.
Think about your production processes. Aren’t they flowing like a river? Is the next part that’s coming down the line exactly like every other part on the line? You may think they are the same, but they aren’t. We tend to make decisions about what to do going forward based on water that’s long since past—production reports from yesterday or last week or last month, or even last year. We should be making decisions about what to do based on what’s hindering that goal in the present.
That’s where workplace organization, and in particular visual management, comes in. You know what is going on at a glance, in a blink.
One goal of visual management is to build participation. When everybody’s participating in deciding what to do because the information is apparent, everyone knows what they’re supposed to be doing.
Imagine you’re the supervisor of an area in the plant, and you’re looking out over it. What is the status of the work in that area? Is it clear to you what’s going on?
Can you make decisions on what to do based on what you see, or are you making decisions based on reports that were turned in 24 hours ago?
Do You Have a Foot in the River?
Visual management reduces or eliminates the need for extensive scheduling. Scheduling can be done by the person whose foot is in the river. He or she knows what should be running and when. This visual management approach is consistent with the theory of 5S (see sidebar).
There are many types of visual management strategies that you can implement. The visuals should be easily understandable, simple communication, continuously updated, and accessible. They should be clear signs that indicate what’s going on.
6 Visual Management Tactics
1. Red tag. Hang a red tag to signify that something is wrong. The operator fills out a red tag and hangs it on the machine. That’s a recognizable visual that says something is not right.
2. Red, yellow, green lights, flags. This is similar to the red tag tactic, but it also indicates when goals are being met or when the situation is tenuous. If it’s green, it’s good, they’re producing on schedule. If it’s yellow, that’s saying the operator is running low on supplies or there’s a time gap or some authorization is needed. Red indicates work has stopped, or there is danger. The colors tend to be associated with some type of symbol: green may be a circle, yellow a triangle, red a square. These should be used because some people are color blind. Visual cues can be used with audible ones as well, like alarms.
3. Floor signs. Another type of visual management may be markings on the floor. They might be color-coded to indicate supply levels. Floor signs can be very powerful.
4. Empty kanban bins. If you’re using kanban inventory, the empty bins indicate something is amiss. Immediately it’s obvious that something is wrong, and it’s usually one of two problems. Either supplies are depleted or the bin is not being used. Either one is a problem, isn’t it? The point is that because of the way it’s organized, you can see it.
5. Open machines. If you open your machines, indicators, like pressure gauges, are visible. A lot of those gauges are behind panels. Opening the machine is a way to put your foot in the river to know whether this machine is performing the way it is supposed to.
6. Dark cockpit. In Blink, Gladwell talks about the quiet dark, cockpit of an airplane. If you look at the cockpit, you’ll see many gauges, but they’re lit up only when there’s a problem. So the idea is the shop is a quiet, dark place without visual overload, but when something goes wrong, lights are lit and alarms sound.
The third S of the 5S is sweep or shine. It’s about cleaning with purpose. If you’ve got an organized workplace, you can pick up on visual cues. These visual cues work because a supervisor can walk through the plant and scan them to know what to work on right now.
As the operator is cleaning, he or she is also inspecting to detect if there’s an issue and correct it before it becomes a problem. They’re looking for leaks, or if something is out of place. A procedure should be put in place so that what is being noted and documented then becomes part of the fourth S—developing a system. It doesn’t have to be complex, just some way of knowing who’s supposed to be doing what, when they’re supposed to be doing it, and what a good situation looks like.
Wind Tower Plant Timer Case Example
A wind tower plant manufactures the towers in sections. The sections comprise rings that are welded together.
Assembling a tower was disorganized. The manufacturer did not have a way of tracking material flow or project completion. It was not meeting throughput goals.
The company performed a process sequence map to assess the problem and isolate the bottlenecks.
One bottleneck was parts, tools, and items needing repair. When something needed repair, staff would stick the broken items over in an area and wait until somebody had time to repair them.
To remedy the bottleneck, a station was set up specifically for repairs. Then a clock with bright blue lights started counting the time a part sat there, so everyone could see how much time passed while it was out of commission, like 12 minutes and 14 seconds. The goal was to have it repaired within 30 minutes.
The timer was a visual that called people’s attention to the quality issue that needed to be fixed. An extra person was designated for repairs. If production backed up, they would shut down one station and put a technician on fixing the part.
The next bottleneck was at the end, after the welding was completed and the ring had to be rerolled. What they used to do was measure the performance of every one of the operations based on an efficiency standard. But all they really needed to track was how many rings they produced and could ship to their customer compared to the goal.
The company installed a lighted sign next to the rerolling operation that tracked the count against their goal. The takt time, based on the customer’s demand, was to produce one about every 30 minutes. So they put a counter there that showed the goal going up every 30 minutes.
If it read: Goal: 5; Actual: 7,” they could see that they were two ahead of schedule.
Letting the Workplace Speak to You
If you place information at the point of use using visual tools, the workplace will speak to you visually, telling you the condition and status of the work and what to do next.
Visual information at the point of use creates real-time situational awareness. Your foot’s in the river. And it’s not only real-time information for the plant manager, it’s also real-time awareness for everybody who works in that area. So it allows everybody to react quickly and make decisions on what should be worked on next.
You cannot thoroughly understand what is happening in an operation until it speaks to you visually.
Theory of 5S
1. Sort
Red tagging
Reduce workplace clutter
Dispose of unused items
2. Set in order
A place for everything
Review need for storage
In-house standardsv
Work flow procedures, inspections
Inventory and material
3. Sweep or shinev
Cleaning with a purposeInspection and detection
Find leaks, noise, which indicate a problemv 4. Standardize
Formulate standards to create consistency.
Standardize work-in-progress (WIP)
Develop a system for visual identification, such as color coding.
Have duty lists
5. Sustain
Continuous improvement takes a long time
Commit and dedicate
Revisit steps
Once you have optimal plant layout, take a photo to refer to
About the Author

Kate Bachman
815-381-1302
Kate Bachman is a contributing editor for The FABRICATOR editor. Bachman has more than 20 years of experience as a writer and editor in the manufacturing and other industries.
subscribe now
The Fabricator is North America's leading magazine for the metal forming and fabricating industry. The magazine delivers the news, technical articles, and case histories that enable fabricators to do their jobs more efficiently. The Fabricator has served the industry since 1970.
start your free subscription- Stay connected from anywhere
Easily access valuable industry resources now with full access to the digital edition of The Fabricator.

Easily access valuable industry resources now with full access to the digital edition of The Welder.

Easily access valuable industry resources now with full access to the digital edition of The Tube and Pipe Journal.
- Podcasting
- Podcast:
- The Fabricator Podcast
- Published:
- 04/16/2024
- Running Time:
- 63:29
In this episode of The Fabricator Podcast, Caleb Chamberlain, co-founder and CEO of OSH Cut, discusses his company’s...
- Trending Articles
How to set a press brake backgauge manually

Capturing, recording equipment inspection data for FMEA

Tips for creating sheet metal tubes with perforations

Are two heads better than one in fiber laser cutting?

Hypertherm Associates implements Rapyuta Robotics AMRs in warehouse

- Industry Events
16th Annual Safety Conference
- April 30 - May 1, 2024
- Elgin,
Pipe and Tube Conference
- May 21 - 22, 2024
- Omaha, NE
World-Class Roll Forming Workshop
- June 5 - 6, 2024
- Louisville, KY
Advanced Laser Application Workshop
- June 25 - 27, 2024
- Novi, MI

