Principal
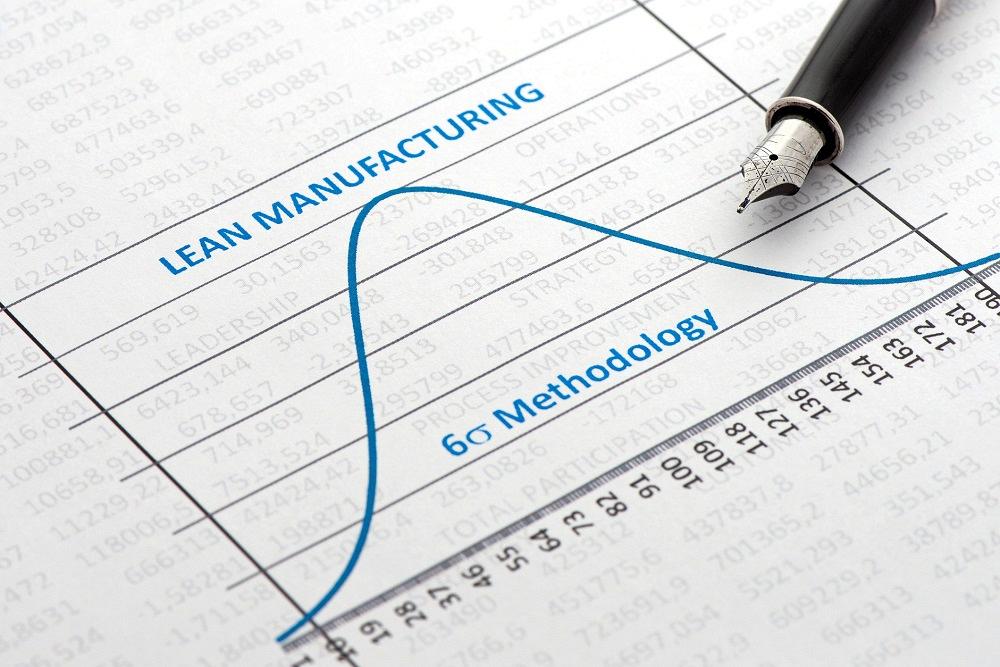
Simple observation is often enough to improve manufacturing processes in the early stages. But as your lean Six Sigma initiative evolves, data plays a bigger role. Getty Images
Early on in any lean manufacturing initiative, you harvest the low-hanging fruit, the easy improvements. Eventually you inevitably find it takes more work to identify impactful improvements, ones that have meaning for your employees and customers.
Basic improvement tools like value stream mapping, process mapping, cause-and-effect charts, and spaghetti diagrams have served you well. You now need to get more creative. To pinpoint the root causes of your remaining problems, you need deeper, quantitative analyses.
As you go beyond the low-hanging fruit, you’ll rely more on data to point you toward improvements. Here, you can turn to what has become known as lean sigma or lean Six Sigma, an approach that uses the complementary elements of both lean manufacturing and Six Sigma. Integrate them and you kick your lean journey into high gear.
In the 1980s and 1990s, lean manufacturing and Six Sigma were considered completely separate, a perception that in hindsight had counterproductive consequences as different improvement initiatives within companies competed for resources. Today we recognize the similarities and differences. They stand apart, but they also complement one another.
Boiled down to their essence, lean manufacturing is about eliminating waste and creating flow, while Six Sigma is about reducing variation. You can do one without the other, of course, but if you look at them entirely separately, you miss the synergy between them.
Put all the elements of each in a Venn diagram, and you’ll see plenty of differences, but you’ll also see a fair amount of overlap. In the diagram’s “pure lean” portion, you find tools like streamlining flow and shortening changeover times. With limited data and modest analysis—again, using tools like process maps, spaghetti diagrams, and fishbone diagrams—you’ll know enough about the process to make significant improvements. The same would apply to everyday kaizen, those small improvements everyone in the company can suggest or do themselves.
You’ll find deep quantitative analysis on the far right, the “pure Six Sigma” part of the diagram. Here, you’re trying to understand what influences variation (that is, the “influencers”) and disrupts the process. At this point you most likely have peeled away the layers of the problem, and you know the influencers well. To dig deeper, you use a control chart to establish process capability and a design of experiment (DOE) approach to understand which factors make a real difference to process outcomes.
Other tools and methods reside in the middle of the Venn diagram, where lean manufacturing and Six Sigma overlap and complement one another. Here you can enhance the basic lean approach using some simpler Six Sigma quantitative tools. A Green Belt level of expertise should suffice to perform measures of central tendency and measures of dispersion, especially for repetitive processes.
You can include repetitive elements of your operation, even in a high-product-mix environment, where the products themselves aren’t repetitive at all. You can analyze this data, slice it down, and model it.
Some processes are data-rich, with transactions captured in your information systems. At the front end of the value stream you have customer-centric information focused on quoting and orders and supplier-related information about pricing, timing, and performance. Near the end of the value stream you find data about shipments, logistics, and payments. In each case, these transactions flow through your information systems.
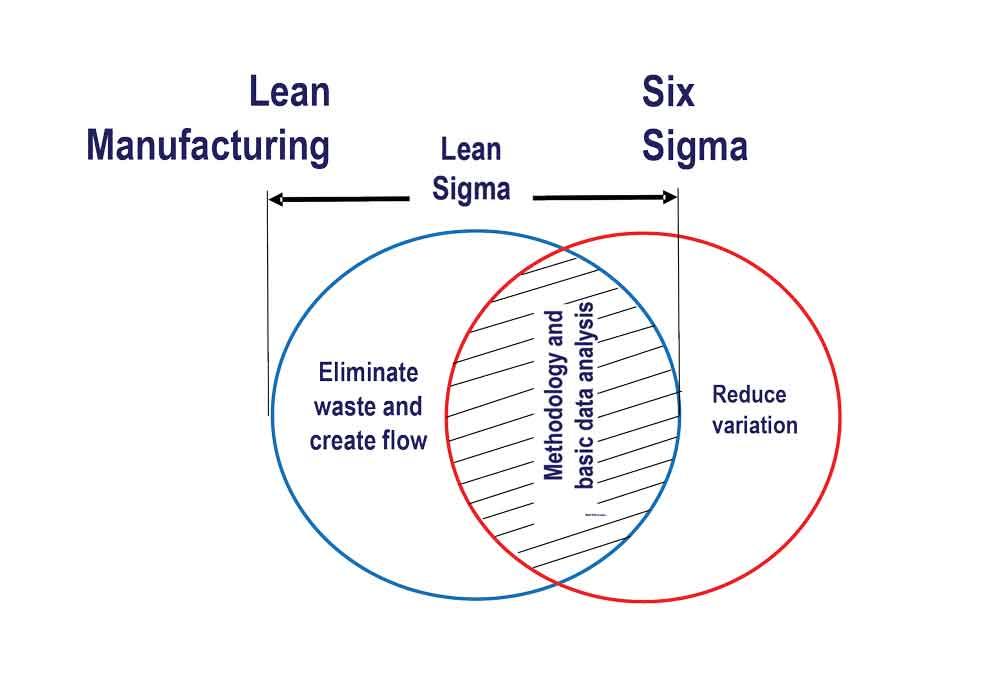
Lean manufacturing and Six Sigma differ in many respects, but the methodologies do overlap. Lean sigma takes advantage of this overlap by using complementary elements of both lean and Six Sigma.
Inside the value stream (within your four walls), you generate data as products flow through your operation. You report data on labor for specific orders, on material issued (and reissued) to the floor, and on completed manufacturing steps.
In the early days of your lean journey, you improved without relying on data from information systems. You were blocking and tackling, rearranging work flows, initiating 5S programs to spend less time looking for things. Eventually you sharpened your focus by collecting data to guide you in setting improvement priorities and determining root causes.
The closer you move toward one-piece flow and cellular arrangement, the fewer transaction-reporting points you have. For instance, rather than tracking jobs as they enter and exit various departments—bending, spot welding, hardware, welding, and assembly—you track only when a job enters and exits a multiprocess cell. This brings up a common conundrum: Data plays an increasingly important role as your lean journey progresses, just when you initiate projects like multiproces cells that capture fewer transactional events in information systems.
But you’ll still find some data. You might have a quality tracking information system that tracks defects, nonconformances, and returns. All provide a treasure trove of potentially useful data that might allow you to dig deep into the influencers of your processes.
As you dig deeper, thorough data will emerge as you study changeover-reduction opportunities on critical operations. Perhaps you’ll collect more detail in different “buckets,” or groupings of time and work, revealing what is truly happening in the process.
Maybe you use a defect map (also called a measles map) to identify where and with what frequency defects are occurring on a part, assembly, or product. At first you might track the number of defects, but nothing more specific. You might determine that a product has, say, 17 defects. But to find root causes, you need more information, so you break it down. After further analyses, you determine that you have 11 defects in the corner of the baseplate weldment, three defects in bend radius on the upper ear, and three cosmetic defects (scratches on the bottom surface), and the frequency of these defects changes depending on the shift and the work sequence in the welding department. You’ve evolved the data-gathering from just counting the defects to dissecting defect types and their frequency, from which you can draw more useful conclusions.
If you look around and are open-minded, you will see data all around you. Sometimes it’s easy to get, especially if it’s already in your information system or is already manually captured. Sometimes the data is useful, but other times it isn’t, at least in the operation’s current state. And yes, sometimes the data isn’t available and you just have to go out and capture it, such as when you observe and record changeover procedures. Regardless, you need data, and gathering it is crucial for the ongoing success of your lean journey.
How Much Analysis Is Enough?
Some people are wired to be very analytical, and no data is never enough. Other people just want to “go do something,” and when it comes to data-
gathering, it is always too much. Neither approach is right or wrong, just different.
How much analysis is enough? The classical answer is to analyze until you know the root cause. This is good guidance, but in practice you might simply apply reason and judgment. It depends on the people involved and the complexity and nature of the data collection. If you need to destroy or scrap a part to gather specific data points, you need to weigh the costs. At the same time, you need to understand the risks that come with limited data and analysis.
So how much is enough? This is where you invoke Goldilocks’ wisdom of process improvement: Not too much, not too little, but just right. Some will be dissatisfied regardless of the amount of data and analysis. Your challenge is to keep everyone reasonable, objective, and focused on results.
Jeff Sipes is principal of Back2Basics LLC, 317-439-7960, back2basics-lean.com. If you have improvement ideas you’d like to read about, email him at jwsipes@back2basics-lean.com or Senior Editor Tim Heston at timh@thefabricator.com.


The Fabricator is North America's leading magazine for the metal forming and fabricating industry. The magazine delivers the news, technical articles, and case histories that enable fabricators to do their jobs more efficiently. The Fabricator has served the industry since 1970.
start your free subscription
Easily access valuable industry resources now with full access to the digital edition of The Fabricator.

Easily access valuable industry resources now with full access to the digital edition of The Welder.

Easily access valuable industry resources now with full access to the digital edition of The Tube and Pipe Journal.

Easily access valuable industry resources now with full access to the digital edition of The Fabricator en Español.
In this episode of The Fabricator Podcast, Caleb Chamberlain, co-founder and CEO of OSH Cut, discusses his company’s...