Data monitoring helps contract manufacturer gain uptime, efficiency on lasers, press brakes
Situation
Founded in a garage in 1945 as a producer of shotshell reloaders, Mayville Engineering Co., Mayville, Wis., has grown into a contract manufacturer with 20 facilities across seven states, providing a variety of prototyping and tooling, production fabrication, coating, assembly, and aftermarket services.
Data collection was becoming a challenge for the company, as some machines tracked their own uptime, while some older laser cutting systems tracked only beam-on time. Operators had to remember to write down the length and causes of machine downtime and then go back and clean up and analyze the information days or weeks after the problem occurred.
“Previously, we were limited to productivity metrics only,” said Michael Wisnefsky, engineering manager. “This proved challenging as a management and improvement tool. We didn’t know what processes or operations were already ‘maxed out’ and operating near 100% uptime, and we also didn’t know where our biggest opportunities for improvement were. Operators would often complain about delays from quality, inventory, engineering, or material handling as reasons for not hitting their production goals, but our attempts to quantify the delays were time consuming and often inaccurate.
“Our goal was twofold: monitor actual machine uptime to drive improvements, and quantify specific downtime reasons to allow us to assign dollar values to issues.”
Resolution
MEC chose the machine connectivity platform from MachineMetrics. It integrated three areas at first—lasers, robotic press brake, and machining—to obtain baseline uptime data before operators knew that data was being collected.
“Shortly after we rolled out our plan and saw what kind of data we were getting, we saw a productivity and uptime gain. [When] operators knew they were being measured … the act of measuring changed how they acted,” Wisnefsky explained.
MEC installed tablets for the operators to use that showed a live uptime percent by shift and allowed them to categorize downtime.
“We saw another increase in productivity with this,” said Wisnefsky. “The direct, live feedback was able to turn it into a game of sorts. This visibility alone turned into a 5% to 10% productivity improvement.”
The plant manager, vice president, and maintenance personnel also have displays in their offices that show the plant dashboards, and they get alerts when machines are down for more than a set amount of time. They meet once or twice a month to quantify how much time and money are lost to each reason code and to focus on improvement ideas.
Operators also can note in their tablets when a machine has a problem so it can be reviewed right away, rather than contacting a supervisor who would then write up and submit a work order.
“After implementing MachineMetrics, we saw between a 10% and 15% improvement in overall uptime and, on top of that, a 15% to 20% efficiency gain,” said Wisnefsky. “Since we run four shifts, that’s the equivalent of almost another shift for free.”
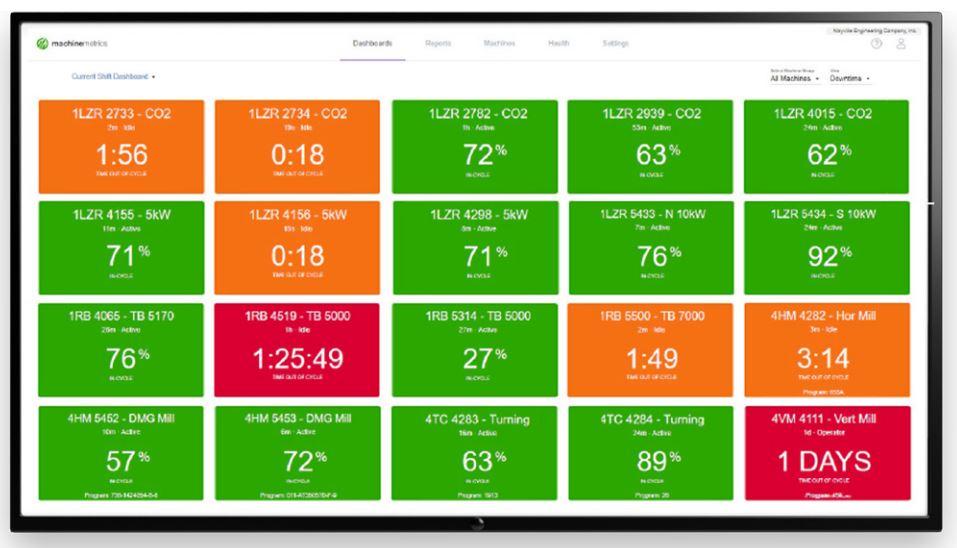
Using KPI dashboards featuring color-coded tiles that indicate when machines are down, the MEC team was able to visualize machine status and production efficiency in real time.
subscribe now

The Fabricator is North America's leading magazine for the metal forming and fabricating industry. The magazine delivers the news, technical articles, and case histories that enable fabricators to do their jobs more efficiently. The Fabricator has served the industry since 1970.
start your free subscription- Stay connected from anywhere

Easily access valuable industry resources now with full access to the digital edition of The Fabricator.

Easily access valuable industry resources now with full access to the digital edition of The Welder.

Easily access valuable industry resources now with full access to the digital edition of The Tube and Pipe Journal.

Easily access valuable industry resources now with full access to the digital edition of The Fabricator en Español.
- Podcasting

In this episode of The Fabricator Podcast, Caleb Chamberlain, co-founder and CEO of OSH Cut, discusses his company’s...
- Trending Articles
1
AI, machine learning, and the future of metal fabrication

2
Employee ownership: The best way to ensure engagement

3
Steel industry reacts to Nucor’s new weekly published HRC price

4
Dynamic Metal blossoms with each passing year

5
Metal fabrication management: A guide for new supervisors