


Waiting for the first shoe to drop
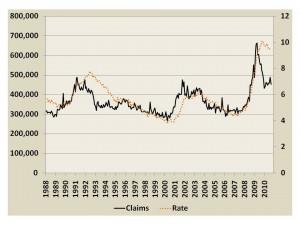
Unemployment Ins. Claims vs. Unemployment Rate
The unemployment rate gets a lot of press during recessions. It’s the main job situation barometer, but it has some drawbacks. It is updated just monthly is subject to several revisions. Another strand of job-related data, the number of claims for unemployment insurance, might be a better indicator. It is tallied weekly and revised just once.
Before I go any further, I should point out that neither of these data sources is a perfect indicator of joblessness.
The number of claims for unemployment insurance is probably the more accurate of the two. It’s based on initial or continued claims for unemployment insurance, which are filed by the unemployed in each state and counted at the federal level. The problem is that some people are unemployed for long periods of time; if they haven’t found employment when the benefits expire, they are no longer counted. In contrast, the unemployment rate is less accurate. It’s based on periodic household telephone surveys, so it’s just a random sampling.
Moving along, how do the two correlate? Not perfectly, but the relationship is clear. The number of initial claims for unemployment insurance rises before the unemployment rate rises, and falls before the unemployment rate falls. In other words, in comparing the two, initial claims for unemployment insurance is pretty reliable as a leading indicator.
That said, the two don’t rise and fall by the same amounts or at the same rate. Throughout the 1990s, for example, the unemployment rate decreased more or less steadily. It fell from 7.1 percent in February 1993 to 3.9 percent in December 2000. During the same time frame, the number of claims had quite a few ups and downs, varying from 266,000 per week to 380,000 per week.
What’s happening now? Initial claims peaked at 663,000 per week in April 2009. It fell to 433,000 per week in January and has bounced around a bit since then, but in the grand scheme of things, it has been flat ever since. The unemployment rate peaked at 10.1 percent six months later (October 2009). It has fallen a bit, but essentially it has held steady and remains at 9.6 percent.
What’s happening next? That’s hard to say, but the number of initial claims is worth watching. The unemployment rate won’t fall until the number of initial claims for unemployment insurance falls, and the unemployment rate will lag by several months.
subscribe now

The Fabricator is North America's leading magazine for the metal forming and fabricating industry. The magazine delivers the news, technical articles, and case histories that enable fabricators to do their jobs more efficiently. The Fabricator has served the industry since 1970.
start your free subscriptionAbout the Author

About the Publication

- Stay connected from anywhere

Easily access valuable industry resources now with full access to the digital edition of The Fabricator.

Easily access valuable industry resources now with full access to the digital edition of The Welder.

Easily access valuable industry resources now with full access to the digital edition of The Tube and Pipe Journal.

Easily access valuable industry resources now with full access to the digital edition of The Fabricator en Español.
- Podcasting

Patrick Brunken, VP of Addison Machine Engineering, joins The Fabricator Podcast to talk about the tube and pipe...
- Trending Articles
1
How laser and TIG welding coexist in the modern job shop

2
Young fabricators ready to step forward at family shop

3
Material handling automation moves forward at MODEX

4
A deep dive into a bleeding-edge automation strategy in metal fabrication

5
Precision Press Brake Certificate Course