President
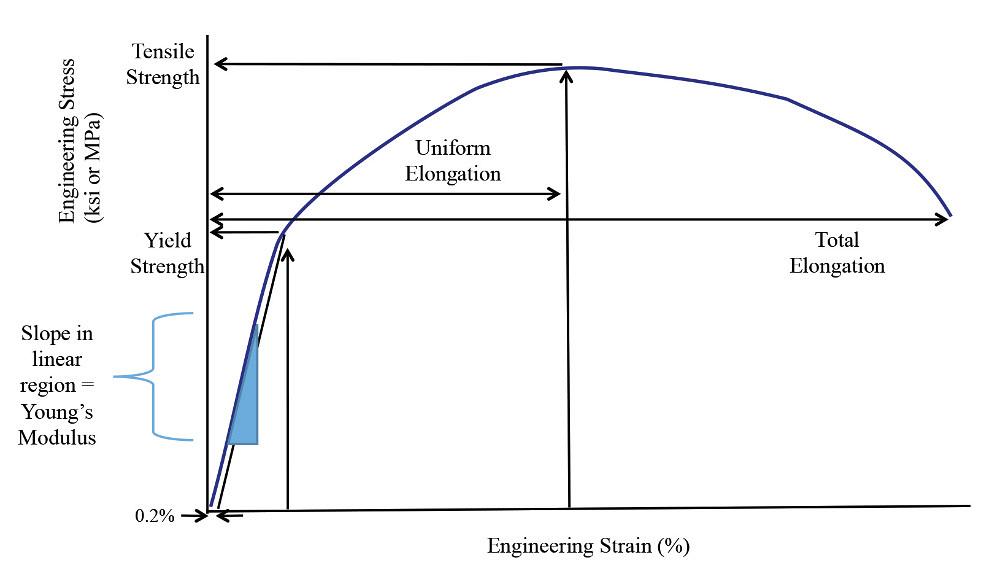
Figure 1: A stress-strain curve charts a material’s yield strength, tensile strength, uniform elongation, and total elongation.
An estimated 3,500 different grades of steel currently exist, with about 75 percent of them developed in the past 20 years. And more than 500 sheet aluminum alloys are registered with the Aluminum Association. Each of these materials grades has a different chemistry and different tensile properties and, therefore, different performance characteristics in fabricating applications.
Two of the most important characteristics of any sheet metal grade are strength and formability. For nearly any application, one or both of these are critical to achieving the functionality of the part. Even with the push for lightweight metals, the chosen part must still be formed into the desired shape while typically maintaining or increasing strength.
Both strength and formability can be characterized in a tensile test. A test sample is prepared in the shape of a dogbone to a particular standard, such as ASTM E8. The sample is placed in a frame and pulled apart at a designated rate. The load and displacement are recorded and converted to stress and strain, respectively, by normalizing the measurements to the starting dimensions.
The load normalized by the cross-sectional dimensions of the dogbone (thickness x width) is equal to the stress. This is why stress is measured in pounds per square inch (PSI).
Displacement over a predefined gauge length (typically 2 inches) is defined as the strain (elongation). Both displacement and gauge length are measured in inches, but displacement divided by gauge length is inches/inches, canceling each other out. For this reason, strain is shown as a decimal or percentage.
If the dogbone sample can return to its original dimensions when the applied stress is removed, only elastic deformation is occurring. The lowest stress that causes permanent deformation is called the yield strength. As the load necessary to continue stretching the dogbone increases, so does the stress on the sample. The maximum stress revealed during the tensile test is the tensile strength. The elongation at which the tensile strength is reached is the uniform elongation.
Until uniform elongation is reached, the deformation in the tensile dogbone occurs uniformly within the gauge length. The dogbone can be stretched past uniform elongation with progressively lower force, since deformation is being localized into a small region known as a neck. This loss of load-carrying capability continues as the dogbone is stretched further, culminating when the sample fractures—a point called total elongation of the material (see Figure 1).
Typically there is a tradeoff between strength and elongation: as one increases, the other decreases. But this doesn’t always hold true, and new alloys are continuing to be developed to minimize this tradeoff.
When the strength and elongation of numerous grades are plotted on the same graph, the general shape of a banana begins to form. As a result, this type of graphical representation is known as a banana diagram.
The global steel industry has used a banana diagram to represent the total elongation and tensile strength of the dozen or so different families of grades that cover the spectrum from interstitial free steels with 50 percent elongation and 280-MPa (40-KSI) tensile strength to martensitic steels with 5 percent elongation and 1,900-MPa (275-KSI) tensile strength.
Newly developed grades rise off the historical strength-elongation boundary, offering higher formability at a given strength level. This allows for more complex designs to be stamped from higher-strength grades. In turn, this higher strength can be used to reduce part thickness, which helps achieve lightweighting targets. Figure 2 plots these grades, along with common automotive sheet aluminum and magnesium alloys. The banana shape can be seen in either the steel grades or aluminum alloys.
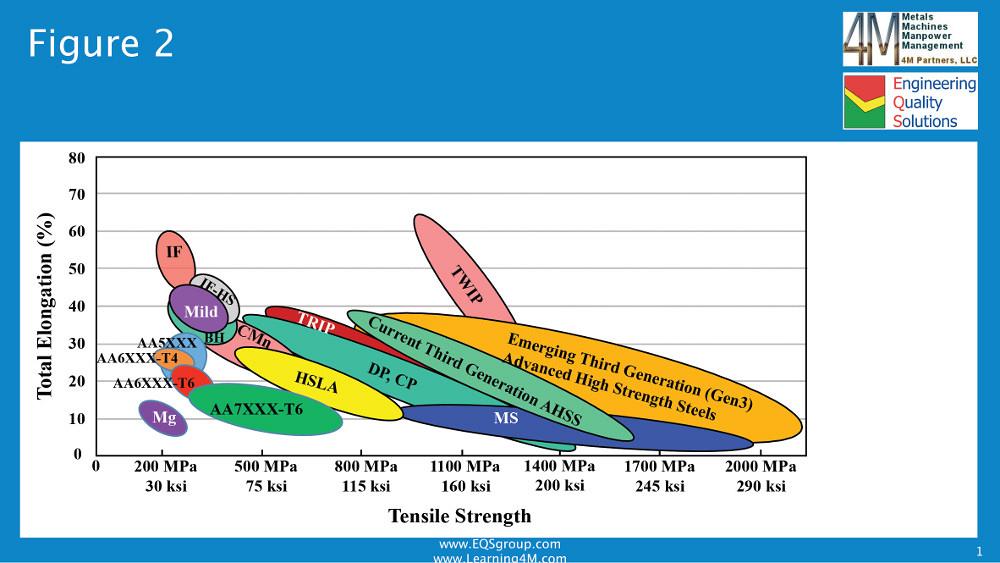
Figure 2: Total elongation and tensile strength are compared for different sheet steel, aluminum, and magnesium alloys at room temperature. Sources: www.alumag.cc/wp-content/uploads/2013/11/RSAL032013ALERISLecture.pdf and www.worldautosteel.org/steel-basics/automotive-steel-definitions/.
The general shape of the chart in Figure 2 would look the same if yield strength was used rather than tensile strength on the horizontal axis. Similarly, substituting uniform elongation for total elongation would not change the overall shape significantly, since for most low-carbon steels, total elongation is twice that of uniform elongation.
Figure 2 gives one perspective on the strength-formability balance of automotive-grade sheet metals. However, the choice of sheet metal often depends on additional factors such as component weight. The density of aluminum is one-third that of steel, and magnesium is two-thirds that of aluminum. As a result, these metals are being considered for an increasing number of applications in which lightweighting is critical. Even some of the advanced high-strength steels (AHSSs) have a significant portion of aluminum, silicon, and manganese in their composition, which lowers their density compared with conventional steels.
Figure 3 shows the effects of dividing the tensile strength by the metal’s density, which is called the specific tensile strength. Not surprisingly, low-density metals tend to have more favorable specific tensile strength.It’s also possible to improve the elongation of aluminum and magnesium alloys significantly by forming them at an elevated temperature, such as 400 degrees F. If this temperature were shown in Figures 2 and 3 rather than room-temperature elongation, the aluminum and magnesium products would appear higher on the graphs.
When choosing among sheet metals, another important consideration is cost. AHSS are up to twice the cost of mild steels, and aluminum and magnesium are three to five times more expensive. Factoring in cost further changes how the rankings are viewed.
When you see a graph that compares multiple items, look at the units on each axis. Your perception of which material is better may be influenced by the way the data is presented. A key first step is for you to understand what is needed for each specific application. Only then can you properly evaluate your material selection options.
References:
www.worldsteel.org/faq/about-steel.html
www.aluminum.org/sites/default/files/TEAL_1_OL_2015.pdf
www.astm.org/standards/e8.htm
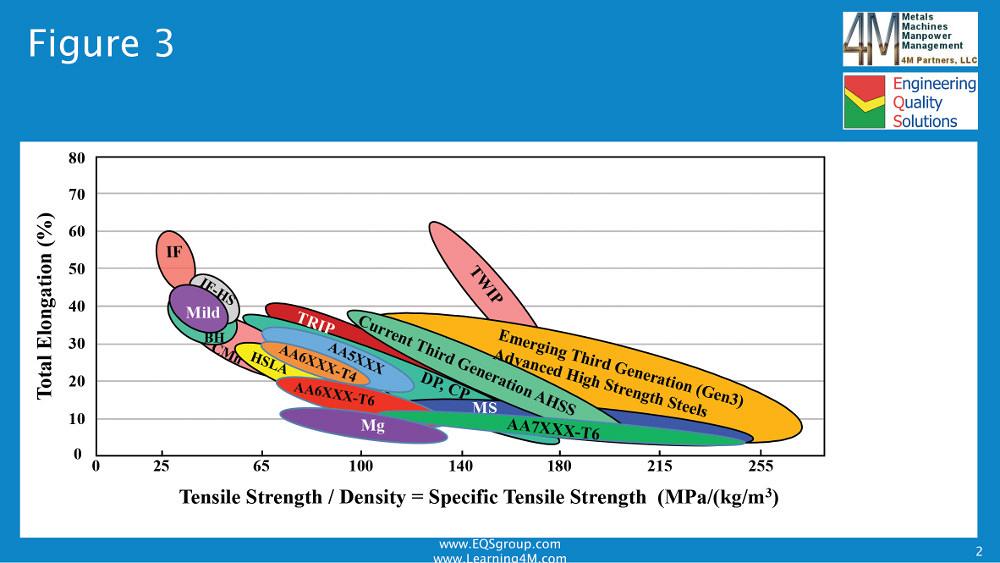
Figure 3: Total elongation and specific tensile strength are compared for different sheet steel, aluminum, and magnesium alloys at room temperature. Specific tensile strength is the tensile strength divided by the density. Sources: www.alumag.cc/wp-content/uploads/2013/11/RSAL032013ALERISLecture.pdf and www.worldautosteel.org/steel-basics/automotive-steel-definitions/.


The Fabricator is North America's leading magazine for the metal forming and fabricating industry. The magazine delivers the news, technical articles, and case histories that enable fabricators to do their jobs more efficiently. The Fabricator has served the industry since 1970.
start your free subscription
Easily access valuable industry resources now with full access to the digital edition of The Fabricator.

Easily access valuable industry resources now with full access to the digital edition of The Welder.

Easily access valuable industry resources now with full access to the digital edition of The Tube and Pipe Journal.

Easily access valuable industry resources now with full access to the digital edition of The Fabricator en Español.
In this episode of The Fabricator Podcast, Caleb Chamberlain, co-founder and CEO of OSH Cut, discusses his company’s...