


Product Manager, ShopFloorConnect

Overall equipment effectiveness (OEE) has emerged as perhaps the most reliable and accurate way to track the effectiveness of production machinery. The practice combines measurements of machine availability (running time versus available time), performance (actual production rate versus maximum production rate), and quality (good parts versus total parts) into one simple, easy-to-understand percentage.
OEE originally was conceived as a quick, back-of-a-napkin method to objectively track the factors that contribute to productivity loss. It was intended to be a paper system, with operator-entered part counts and manual time tracking.
Unfortunately, one of the areas that can benefit the most from tracking OEE—short-run, high-mix contract manufacturing—is also where it is most difficult to implement in its traditional manual form. Fortunately, OEE can be tracked automatically in a way that can be used by shops with frequent product changeovers.
Low-product-mix manufacturers dedicate machines and processes to one product or product family. This makes it straightforward to measure machine cycle times, since the operations don’t change significantly from day to day. All this makes the OEE calculation simple.
Different iterations of OEE formulas exist, but just to illustrate a point, consider the following version. Again, OEE incorporates machine availability, performance, and quality. Specifically:
Availability = Running time /
(Total time – Planned downtime) × 100
Performance rate = Total parts/
(Ideal performance rate × Running time) × 100
Quality rate = Good parts / Total parts × 100
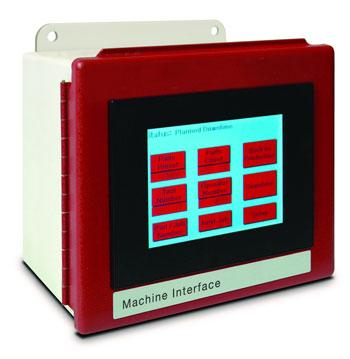
Figure 1: This interface connects to one or two commonly available machine control signals, allowing it to count parts or machine cycles for OEE data collection.
Multiply these three percentages together, and you get the OEE, as in:
OEE = Availability × Performance rate × Quality rate
Now consider applying these factors in a high-mix, low-volume operation. The machine’s quality rate percentage—that is, the number of defects compared to the total number of parts run—remains straightforward, regardless of the part mix. It isn’t a perfect metric, because some parts are harder to manufacture, some more expensive. A few scrapped titanium parts can cost more than dozens of small mild steel brackets. But with modern machine tools and design-for-manufacturability efforts, many best-in-class fabricators have been able to maintain extremely low defect rates across their entire product mix.
But how about availability? This involves more than just tracking machine uptime, or running time. The planned downtime factor in the formula refers to schedule lapses, allotted breaks during a shift, and the like. In all manufacturing environments, but especially in job jobs, some causes of downtime negatively affect OEE, but others do not. If a machine is down a long time because an operator can’t find the right tools to set up the machine, that prolongs setup time and, hence, negatively affects OEE. But say a machine is idle simply because it has no more work on the schedule, though is still available if needed. Depending on the situation, this may not have a negative impact on OEE.
What about the performance rate? For this, you need a standard “ideal” performance or cycle time. But in a job shop, nothing is standard. Every job can have its own ideal cycle time, and this again makes a true OEE calculation extremely challenging.
All this presents a dichotomy. A high-product-mix operation, which can benefit most from improvements gained with OEE, also presents the greatest challenge for implementation. Your OEE effort is only as good as the data you have, and retrieving this data manually in a job shop environment can be arduous.
In a typical scenario, you enter production data manually at predetermined times, such as at the end of a shift or job. The data is then made available in the form of reports and used for analysis. For long-term analysis, viewing the data “after the fact” is usually sufficient. However, the factory floor is a dynamic environment, and knowing only what happened after the fact can be a detriment to productivity.
Manually collected data also can be inaccurate. An operator may first write data down by hand. He or another person then may enter the information into a database. Typographical and transcription errors can abound, and once errors become part of the data set, they become difficult to detect and eradicate. This makes all the resulting production reports suspect.
In a short-run environment, data is often incomplete when you need it, because the actual data entry task falls to someone with many other responsibilities. Let’s be honest: Data entry is tedious, boring, and often put off for as long as possible. Reams of data may lie around for hours if not days before being entered into the system.
If an OEE report lacks the latest data, it’s inaccurate. To properly track a high-product-mix, short-run environment, you must enter the data frequently. This causes the manual data entry task itself to become a measurable source of production loss.
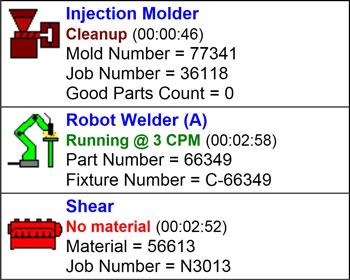
Figure 2: At this shop, the injection molding system and shear are experiencing downtime. The operator selects the reason for the downtime from a drop-down menu.
Manually collected data also is biased. It is unrealistic to expect a machine operator—whose livelihood may depend on the very numbers he’s reporting—to be unbiased when recording uptime and production counts.
The key to getting timely, accurate, and unbiased data is to collect as much information as possible without any human involvement, and then make it easy for the operator to provide any missing required information. Automatic data collection refers to a system that tracks the actual running time, or uptime, of a machine and records production counts without any operator input. The system itself consists of centralized software that collects, stores, and creates reports from the information, as well as machine-mounted electronic hardware that counts parts or machine cycles, and detects whether or not the machine is running.
While you may prefer to get this information directly from an existing machine controller, it is often impractical or impossible to modify proprietary electronics to communicate with generic data collection software. Instead, most OEE systems employ a dedicated machine interface (see Figure 1).
Think of the machine interface as a data collection “appliance” with built-in network capability and communication drivers that talk to the data collection software. Since the machine interface only needs to count parts (or machine cycles) and detect whether or not the machine is running, it can be installed on any machine by tapping into one or two commonly available machine control signals.
While automated OEE data collection can detect when a machine is down, it cannot always determine why it is down. To use the collected information in a downtime reduction program, some operator involvement is necessary to identify the reasons for downtime. The easiest way to obtain this information is to place a menu of downtime reason choices on the machine interface. Whenever the machine stops, the operator selects the appropriate reason from the list (see Figure 2).
Each reason can affect the OEE calculation in different ways, and how certain categories are classified can depend on company practice. For instance, when a job is finished and there is nothing left on the schedule, you can identify the downtime as a lapse in the schedule. Your company may classify a lapse in the schedule as “planned downtime.” The machine may be idle, but it can still jump into action if needed; that is, it won’t negatively affect availability in your OEE calculation.
On the other hand, time spent on machine setup means it is tied up for a specific job (and hence unavailable for anything else), but not producing a product—which is why, in lean parlance, setup is classified as non-value-added time. In general, the longer your setup time, the lower your OEE.
To ensure that the operator specifies a reason for each significant downtime event, the machine interface can inhibit further machine operation until the operator selects a reason for the downtime. This minimizes the amount of time attributed to an “unknown reason,” which, of course, isn’t very useful.
Even with the availability portion of OEE automatically collected, traditional OEE comes up short in high-product-mix, low-volume manufacturing applications. This again goes back to determining the “performance rate” factor, where the true, ideal production rate, or cycle time, depends more on the parts being fabricated than on the machine itself.
Consider the following example: A machine making Part A produces 6 parts per hour. After a job change the same machine produces Part B at a rate of 12 parts per hour. Since standard OEE compares a machine’s actual performance to a single ideal rate, it would indicate that Part B is running at twice the efficiency of Part A. However, let’s say that under ideal circumstances, the machine actually is capable of producing Part A at 7 parts per hour, and the much simpler Part B at 30 parts per hour. In actuality, the machine was running at 86 percent efficiency while making Part A, and only 40 percent efficiency for Part B.
You theoretically could factor out these errors manually for each job, but this becomes extremely difficult when you’re trying to summarize OEE over a long period. The calculations required to “weight” jobs of varying length also become very complex.
Automation can help here too. Instead of trying to apply a single ideal performance by machine only, a unique ideal performance rating can be applied to each machine/part combination. To do this, OEE software stores a table of parts that each machine is capable of producing, along with an ideal rate for each machine/part combination.
To calculate OEE, the software applies the appropriate ideal rate for each part being produced by the machine. This allows the system to calculate the number of parts that could have been run under ideal circumstances, while properly weighting disparate jobs with different cycle times.
Every manufacturer wants to reduce setup time, but few look at optimization, which takes a broader perspective. At its foundation, machine changeover entails the end of one job, the tool changeover, and, finally, the beginning of the next job.
Setup time reduction involves the procedures between the two jobs—that is, the tool changeover. Are tools labeled correctly and staged for the next job near the machine? Are standard work instructions complete? Is material for the next job staged? How much time is spent running test pieces?
Setup optimization, however, also includes the sequence of the jobs themselves. Automated OEE systems can interpret setup times and tools necessary for each job, and group similar jobs together so an operator can transition from one job to the next quickly. This immediately improves efficiency and can run in parallel with a standard setup time reduction program. The more frequently you change jobs, the more important this type of optimization becomes.
Your goal is to improve the efficiency of your equipment, and a robust OEE tracking system enables you to identify underperforming equipment quickly. By tracking OEE along with the reasons for downtime, you identify the leading causes of availability losses.
Once the reasons are identified and quantified, you can begin to address the root causes of your downtime, and then use your OEE tracking system to measure the efficacy of your improvements. As you make your processes more efficient, three things happen: You increase profitability, you decrease lead-times, and you make your OEE tracking system less important.
That’s right. The more improvements you make, the less important it is to track OEE—at least this has been the traditional thinking with manual data collection. With any OEE program, you get the most bang for your buck at the beginning, when you identify and eliminate the most serious and easily correctable issues. Once you’ve picked the low-hanging fruit, further improvements become more complicated and expensive. This is one of the reasons that OEE was originally conceived as an informal paper system: Once OEE had served its usefulness, you simply stopped measuring for it. The savings from process improvements just weren’t enough to offset all the time it took to collect the data manually.
Automated data collection changes the situation. Like with manual systems, the most rapid and dramatic improvements occur early on, and over time the improvement becomes incremental. But unlike manual systems, automated data collection doesn’t demand much time from the operator. Some operator input remains, like selecting the reason that a machine is down, but this doesn’t take long, and it’s more than offset by even small, incremental improvements gained in a mature OEE program.
Moreover, an automatic collection system records events as they happen, in real time (see Figure 3). This allows the system to immediately recognize machine stoppages and to recalculate constantly and update key performance indicators (KPIs) for your machines. The real-time data allows you to continue to benefit from your data collection system, even if you’ve made all the low-hanging-fruit improvements. Once all of your improvements are in place, the efficiency of any given job on any given day will depend in large part on how quickly operators or maintenance personnel can respond to normal machine stoppages. A real-time system can notify the appropriate people quickly—through text/e-mail messages and large-format displays around the factory—whenever a machine stops.
Also, manufacturers that display KPIs in real time as they begin their improvement program see an average increase in OEE of 9 percent without making any hard improvements to their equipment or processes. The reason for this is human nature. When operators see their performance displayed on a scoreboard for all to see, their natural competitive instincts kick in, and efficiency improves because nobody wants to be at the bottom of the list.
Managers of job shops and contract manufacturers work with forever changing product mixes. The product mix in the morning could be completely different from the one in the afternoon. It makes the job fulfilling, because every day presents a different challenge. But it’s also an environment that can go out of control quickly, which is why process measurement like OEE can be such an essential tool.
Consider the press brake department, a bottleneck operation for many metal fabricators. What’s the uptime? What’s occurring during the downtime? How long does setup really take? All this can be extremely time-consuming to measure, so much so that you might question why you’re measuring for OEE at all.
Software and automated data collection change the situation. By calculating the ideal rate and actual running uptime for each job, the software can track how many parts could have been made, and can then calculate the performance percentage by comparing this to the number of parts that were actually made.
This is powerful information for any manufacturer to have—and especially the job shop.

The Fabricator is North America's leading magazine for the metal forming and fabricating industry. The magazine delivers the news, technical articles, and case histories that enable fabricators to do their jobs more efficiently. The Fabricator has served the industry since 1970.
start your free subscription
Easily access valuable industry resources now with full access to the digital edition of The Fabricator.

Easily access valuable industry resources now with full access to the digital edition of The Welder.

Easily access valuable industry resources now with full access to the digital edition of The Tube and Pipe Journal.

Easily access valuable industry resources now with full access to the digital edition of The Fabricator en Español.
In this episode of The Fabricator Podcast, Caleb Chamberlain, co-founder and CEO of OSH Cut, discusses his company’s...


