


Senior Editor

Standing at his booth at FABTECH®, held in Atlanta in November, Drew Greenblatt, his voice hoarse after a day of conferences and networking, kept on talking.
“We’re very optimistic,” said the president of Baltimore-based Marlin Steel. “During the next couple of weeks, we’re going to be busting down the wall and adding 53 percent to our factory floor space. Our existing customers are getting more bullish, and we’re seeing a lot of stuff coming back from China. There are huge signs of optimism and growth.”
Marlin, which produces wire baskets and custom sheet metal components and assemblies, employs 32 people and is growing from 28,000 to 43,000 square feet. The facility is running seven days a week, and it even started a weekend night shift just to keep up with all the work. Greenblatt is increasing the company’s electrical service as well. “We’re going to have 600 percent more power than we currently have, just because we’ll be buying so much equipment in the near future.”
Greenblatt may be more bullish than others, but his actions aren’t unusual, judging by the responses received from the “2015 Capital Spending Forecast,” a study published by the Fabricators & Manufacturers Association International® and released at FABTECH. The report covers major spending trends of U.S. buyers of sheet metal, plate, and structural fabrication equipment.
Overall projected capital spending growth has slowed from the dramatic rebound seen postrecession—at $2.3 billion, 2015 projections are up only 3.5 percent over 2014—but the growth continues all the same, and the spending has shifted. Fabricators are expecting to spend much less on consumables and supplies (down almost 30 percent) and much more on capacity-building machinery, especially for cutting and forming, where spending has jumped past prerecession levels (see Figure 1).
Projected hydraulic press brake spending jumped 30 percent from last year’s projection. This year the survey split out laser cutting machine spending into two categories, CO2 and solid-state (fiber and disk). Tracking the two separately shows just how far the solid-state sheet metal cutting laser has come. Based on data from more than 700 respondents, the survey reported that fiber and disk laser spending has nearly caught up to spending on CO2 lasers. Combined, projected CO2 and solid-state laser cutter spending amounted to a 22 percent increase over a year ago.
If you combine hydraulic press brakes and other sheet metal forming equipment, like panel benders and folding machines, you find that 2015’s projected spending on sheet metal bending surpasses projected spending on laser cutting machines. In recent history, that’s a first. It’s especially significant considering the relative cost of a press brake versus a laser cutting system. True, modern press brakes with advanced controls, along with folders and panel benders, are pricier than your run-of-the-mill press brakes, but they’re also more productive. Regardless, a shop that increases its cutting capacity probably needs to increase its bending capacity. The fastest laser in the world won’t make a fabricator more money if it just creates a bottleneck at the bending department.
In the heavy fabrication arena, the capacity-building trends continue. Plate rolling machine spending is up more than 50 percent, and plasma cutting is up almost 14 percent. Waterjet machine spending is up 22 percent.
Besides consumables, fabricators reported they would be spending less on welding power supplies (though it’s still within the top three spending categories), less on band saws, less on wire bending equipment, and a few other machine types. Regardless, almost 90 percent of respondents said their predicted equipment spending this year will remain the same or increase. Only 9.7 percent said they expected to spend less.
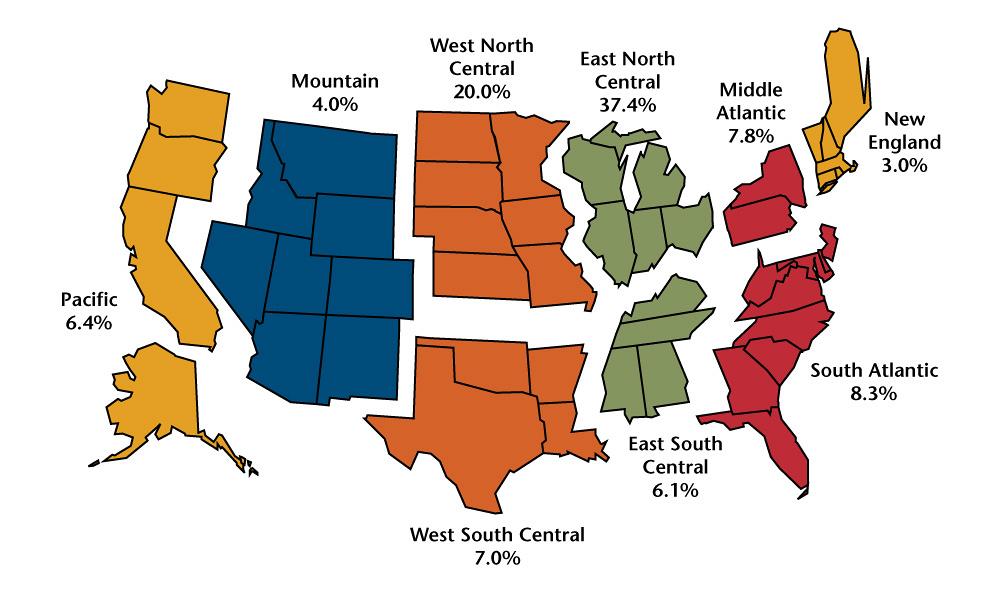
Where do the spenders reside? This year’s report placed the usual suspects in the Upper Midwest: Illinois, Michigan, and Wisconsin rounded out the top three states, while Minnesota took the No. 4 spot. Within the top 10 states, only one is in the Southeast: Tennessee. Metal fabrication has expanded greatly in the South and elsewhere, but the ring around Lake Michigan still seems to be the industry’s epicenter (see Figure 2).
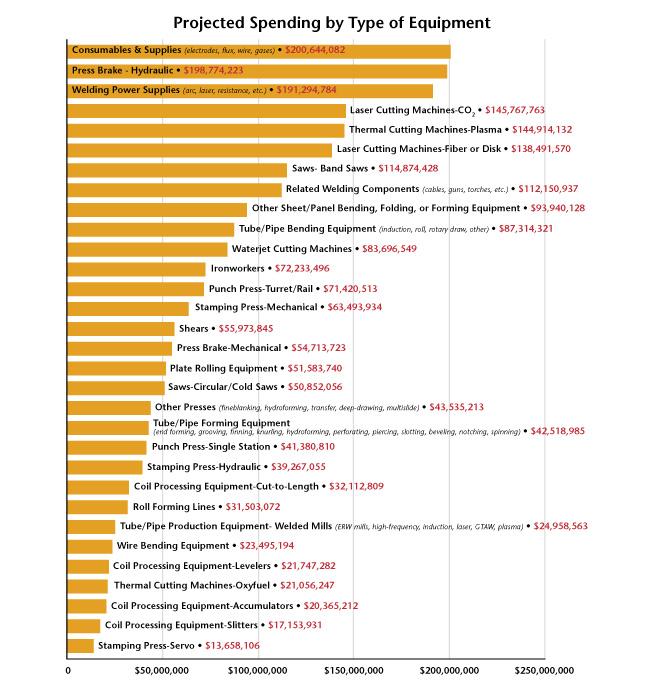
Figure 1
Fabricators are expecting to spend much less on consumables and supplies (down almost 30 percent from 2014) and more on capacity-building machinery.
What industries do the big spenders serve? Reflecting the automotive rebound, motor vehicle parts topped this year’s list; average predicted spending jumped a whopping 81 percent. Another big winner was farm machinery (up 56 percent), as was fabricated structural metal manufacturing, where average spending more than doubled from 2014.
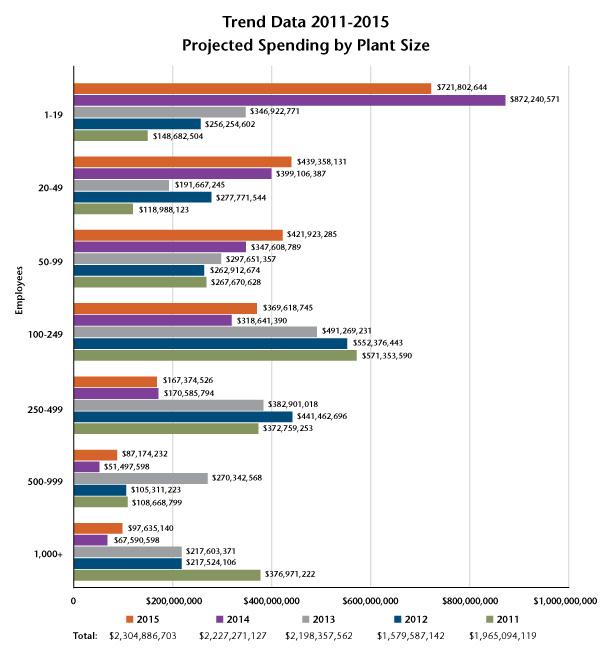
How big are the big spenders? Individually, small fab shops don’t spend much, but because there are so many small shops, collectively their equipment spending usually dominates this business, and this year’s survey reflected that. It also shows just how far small-shop spending (1 to 19 employees) has come since the Great Recession. At these small shops, projected equipment spending for 2015 is almost five times what it was five years ago.
Taken together, the few large players represent a small portion of overall capital spending in metal fabrication, but taken individually, they have plans for some serious spending. For companies with more than 1,000 employees, average planned spending dollars jumped almost 60 percent from last year.
Relating equipment spending to company size, and comparing that data over the past several years, reveals some intriguing trends in business conditions since the Great Recession. Medium-sized shops, those with 100 to 250 employees, were the first to ramp up equipment spending four years ago, at a time when smaller shops were still holding back. Since then, though, the small shop has stepped up in a big way (see Figure 3).
Every year the survey asks about motives, about why people buy equipment, and every year the survey shows similar results. In 2011 and 2012, the “reduce costs” response topped the list, followed by “increase capacity,” then by “make versus buy”—that is, buying equipment to perform previously outsourced processes in-house. By 2013, as the economic recovery ramped up, “increase capacity” took the lead, but the top three reasons remained unchanged—less cost, more capacity, and make versus buy.
But this year one category leapfrogged over “make versus buy” and took the third-place spot: “machine/process flexibility.”
Shops need capacity, but to truly increase throughput, they need flexibility. A laser cutting a million inches per minute can’t make a shop more money if the blanks sit forever waiting for bending and welding. It’s about offline programming, flexible optics on lasers, expanded magazines on punch presses, fast tool changes on press brakes, flexible fixturing for welding robotics, a color change on a powder coat line measured in seconds, with continuous improvement and lean practices gluing it all together. Many now are scrutinizing what happens before, between, and after actual fabrication, and trends in equipment spending may be reflecting this reality.

The Fabricator is North America's leading magazine for the metal forming and fabricating industry. The magazine delivers the news, technical articles, and case histories that enable fabricators to do their jobs more efficiently. The Fabricator has served the industry since 1970.
start your free subscription
Easily access valuable industry resources now with full access to the digital edition of The Fabricator.

Easily access valuable industry resources now with full access to the digital edition of The Welder.

Easily access valuable industry resources now with full access to the digital edition of The Tube and Pipe Journal.

Easily access valuable industry resources now with full access to the digital edition of The Fabricator en Español.
In this episode of The Fabricator Podcast, Caleb Chamberlain, co-founder and CEO of OSH Cut, discusses his company’s...


