John Tyson and Konstantin Galanulis
 |
One option for stamping quality control to help fabricators determine shape, strains, and thinning is full-field optical vision technology. Based on the principles of circle grid analysis and photogrammetry—the science of making precise measurements by recording and analyzing photographs—optical vision technology provides automated analysis and quantitative color maps for every square inch of a complex part. The quality results can be displayed in a 3-D computer model, using the actual measured dimensions of the real part, and viewed from any angle.
Using this technology, stampers can verify finite element models with compatible data from factory tests on the real part. They also can use it for initial die verification, first-article inspection, ongoing checks for die wear, tooling alignment, and new material lots.
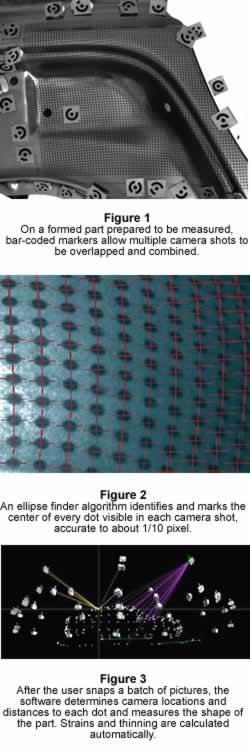
A circular dot pattern is electrochemically etched onto the unformed sheet, exactly as it would be with circle grid analysis. The usual dot size is 0.5 to 2 millimeters, and spacing is 1 to 4 mm. After forming, a scale bar and a series of bar-coded markers are distributed around the part (seeFigure 1).
The user snaps a series of pictures of the stamped part with a digital camera connected to a computer. The exact camera locations are arbitrary, as long as every area of the surface is contained in at least three pictures from different angles. An ellipse finder algorithm identifies and marks the center of every dot visible in each camera shot (see Figure 2). Each dot occupies at least three to six pixels on the camera, so the center can be interpolated with an accuracy of about 1/10 pixel.
The system determines the 3-D coordinates of the center of each dot using the principles of photogrammetry. The software calculates both the camera locations and the distances to each dot to measure the shape of the part (see Figure 3).
In circle grid analysis, the stretching of individual dots is measured and compared with the known original dimensions to indicate strains. In the camera-based system, the distance between all of the dots is compared to the known originals using a larger neighborhood of points. Because the 3-D coordinates of the surface are measured, the actual deformed shape is documented, and the resultant material thinning is calculated using the constant volume assumption.
 |
The calculation process is automatic and requires up to 20 minutes, depending on the complexity of the stamping and the number of camera shots required to document it fully. Once processing is complete, data can be presented in a variety of ways.
In one data presentation method, each of the stamping's measurement points is shown as an individual point on both the forming limit diagram (FLD) and the 3-D color strain map. With a dynamic link between the FLD and the strain and thinning color map, when a point is clicked on either display, a second crosshair automatically highlights that same point on the other display, and a detail box presents all measured and calculated quantities (see Figure 4).
This technology's accuracy can be as high as 0.5 percent strain. At the die tryout stage of a project, and for ongoing die monitoring and material lot verification, total area coverage with vision-based technology can provide complete quality documentation for advanced product quality planning (APQP) to meet QS-9000 requirements.
When a camera is directly connected to a computer, no image import steps are necessary. The computer controls the digital camera's shutter to overcome potential problems with highly reflective surfaces such as aluminum. Data analysis is automatic, and there is no need for calibration before each measuring session.
Data to create an FLD for any known material can be imported. Alternatively, a two-camera version of the technology, called 3-D image correlation photogrammetry, can be used to determine the FLD experimentally for any new material or to study the strength of the materials under load, as a full-field optical strain gauge. Limited areas can be measured in minutes, and entire parts can be documented fully and archived for quality control purposes.
 |
Vision systems can be used with many material types and forming processes, as long as the applied pattern has high contrast. A stamper can select whether to use light dots on a darker background, such as with steel, or dark dots on a lighter background, as with aluminum. Beyond conventional stamping operations, vision systems are applicable to other processes, such as inverted toggle drawing and hydroforming.
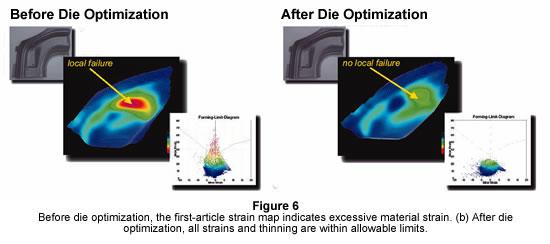
A vision system is suitable for large, complex parts; when material is being taken near its forming limit; and for investigating new materials and processes. For example, the system can inspect the entire surface of a 1.2-m-long pillar (see Figure 5), display the distance to the forming limit curve for each point, and present the graphic from any angle. It also can indicate hot spots, or areas that exceed the forming limit diagram (see Figure 6). Identifying such hot spots allows engineers to optimize the die to bring strain and thinning within acceptable limits.
Tim Schmidt is vice president and John Tyson is president of Trilion Quality Systems, Four Tower Bridge, 200 Barr Harbor Drive, Suite 400, West Conshohocken, PA 19428, 610-722-5100, fax 610-722-5099, info@trilion.com, www.trilion.com. Dr. Konstantin Galanulis is a director of GOM mbH, Mittelweg 7-8, Braunschweig, Germany, D-38108, 011-49-531-390290, fax 531-390-2915 K.Galanulis@gom.com, www.gom.com.

The Fabricator is North America's leading magazine for the metal forming and fabricating industry. The magazine delivers the news, technical articles, and case histories that enable fabricators to do their jobs more efficiently. The Fabricator has served the industry since 1970.
start your free subscription
Easily access valuable industry resources now with full access to the digital edition of The Fabricator.

Easily access valuable industry resources now with full access to the digital edition of The Welder.

Easily access valuable industry resources now with full access to the digital edition of The Tube and Pipe Journal.

Easily access valuable industry resources now with full access to the digital edition of The Fabricator en Español.
In this episode of The Fabricator Podcast, Caleb Chamberlain, co-founder and CEO of OSH Cut, discusses his company’s...