


CEO/Co-founder
Muharrem Huner / DigitalVision Vectors / Getty Images
“Half the money I spend on advertising is wasted; the trouble is, I don’t know which half.” Ever heard that before? The quote comes from John Wanamaker, a U.S. businessman who worked in the late 1800s and early 1900s.
Digital advertising can be rough, but it still provides a unique connection to potential customers. The trick often comes down to understanding how much to spend and where. This isn’t the year 1900. In 2023, you should expect to understand not only which campaigns work, but how much you should spend on them to meet your business goals. To make efficient use of digital advertising, you need to answer the following key questions:
A digital advertising strategy should be tuned for your business. Are you highly liquid and aiming for rapid growth to please investors? If so, you can afford to spend more without seeing an immediate return, earning higher revenue at the short-term expense of lower contribution margin. Are you a bootstrapped company where cash is king? Your advertising dollars will need to produce positive cash flow in the short term, possibly at the expense of lower year-over-year growth. The ideal campaign depends on your company’s financial position and growth goals.
This analysis should translate into a specific statement about how and when your ads should bring value back into your business. You might want a return on your investment in one month or one year. You might have a specific goal, such as acquiring three new contracts per month.
Immediate profitability is a great goal, but it can be difficult in a crowded ad space. Putting a timeline on profitability allows for higher immediate spend, with repeat customers generating more value long term. And a fixed ad budget can be allocated across many different advertising channels (think social media, search engines, YouTube, etc.). The distribution of that fixed budget will be affected by which platforms are most effective over the target time range.
Marketing strategies change with the advertising platform and how its audience uses it. Trade publications (like the one you’re reading now, either print or online) have curated circulations full of longtime readers. People know and respect the publication’s brand.
Online platforms like Google don’t have that kind of relationship with their users. Someone who clicks on an ad is usually hunting for something specific, now. If they don’t find what they want quickly, they click away and move on. Marketing strategies need to take this behavior into account.
Considering all this, what follows is a sampling of OSH Cut’s digital advertising strategy—specifically, a single campaign on Google Ads.
It’s hard to overstate how important this is. You can’t know how much to spend on advertising if you don’t know what your customers are worth.
For example, Figure 1 shows an example of OSH Cut’s customer value model. This kind of modeling works best for “sticky” customers who keep coming back and ordering again. That’s common in manufacturing, which is great. It’s far more difficult to advertise efficiently if your customers order once and never again. Even so, some customers will order only once, and those should also be included in the average lifetime value model.
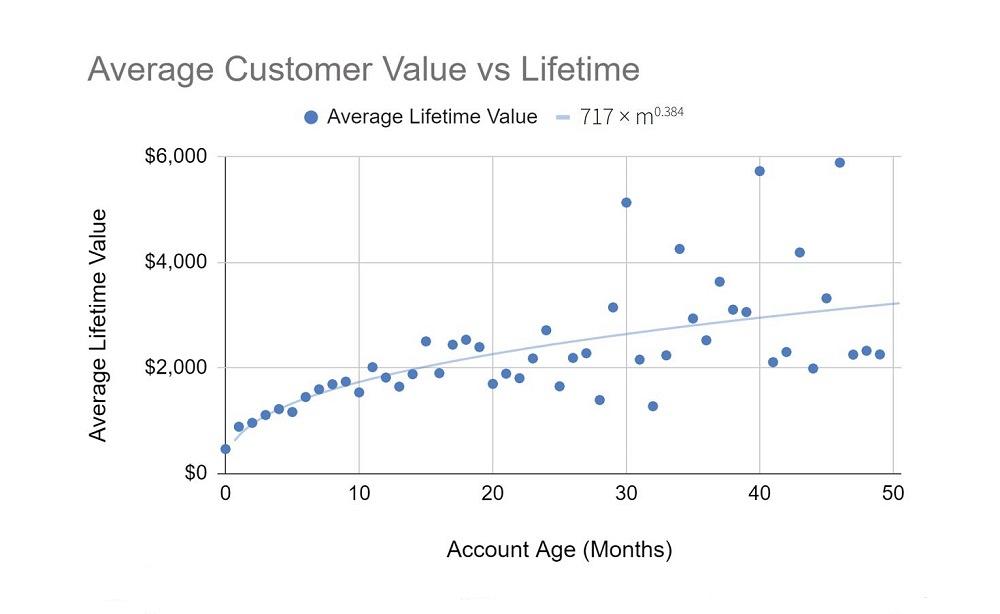
FIGURE 1. Average customer lifetime value vs. the account age in months. Data has been skewed and obfuscated, but it illustrates how customer value can be modeled over time.
Once you have the data, you can fit an equation to the average lifetime value at any period of time. A power series can be used to model the value in Figure 1:
ltv = 717 × m0.384
where ltv is the lifetime value and m is the number of months since the customer was acquired. If you don’t know how to fit an equation to data, don’t worry. Spreadsheet software like Google Sheets or Microsoft Excel can do most of the heavy lifting for you.
Building a customer value model like this shines a spotlight on what you can spend. If you want to break even on ads in six months, your average customer is worth $1,426 in that time, and your gross margin is 40%, then it’s probably worth spending up to $571 to acquire each new customer. That doesn’t necessarily mean you should spend that much. Perhaps you can meet your growth objectives while spending less.
Once you have a solid customer value model, you can use it to sanity-check your marketing efforts, both globally and per campaign. You can divide your total ad spend by the number of acquisitions in a period, and if it’s above your acquisition cost target ($571, in the example above), then you are spending too much. If it’s below your target, you can spend more, hopefully acquiring more new customers in the process.
The real magic happens when you pair your customer value model with advertising channel models. This can be tricky because circumstances change, sometimes very quickly. If you pay for ads on platforms like Google, the amount you spend and the number of acquisitions you obtain can change overnight if another competitor starts (or stops) bidding on the same keywords. Add fluctuating demand to the mix and it can be hard to know exactly what will happen when you change strategies.
Even so, the best campaigns do lend themselves well to analysis. If you have no idea whether your ads are working, it might be worth shifting to an advertising channel or campaign that is better behaved.
Figure 2 shows an example of how the number of weekly conversions might scale with target cost per acquisition, or CPA. In Google Ads, you can configure a “target CPA” and let Google automatically bid on ad placements. If you are willing to spend more to acquire a customer, your ads will show more often and in more favorable positions in search results. That produces more conversions, but (of course) at higher cost. Note that there is often a lag between when ads are viewed and when conversions happen. That can and should be modeled as well.
As your ad spend increases, you’ll start to hit a point of diminishing returns, where spending more has a smaller impact. Measuring and understanding that behavior allows you to understand what your ad budget should be to meet growth and profitability goals. From the data in Figure 2, we can relate conversion count to CPA using the following equation:
con = 0.11 × cpa + 9.34
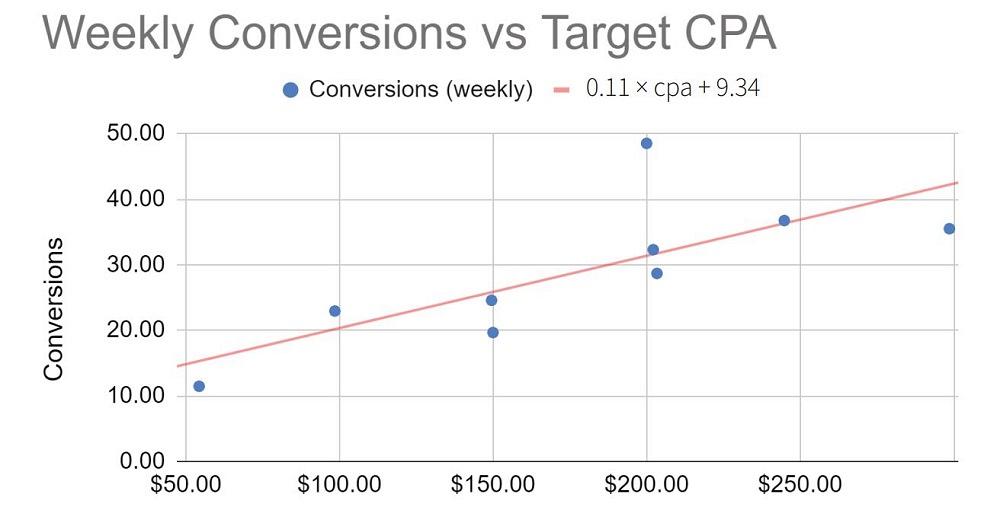
FIGURE 2. Weekly conversions vs. target CPA in a Google ad campaign.
where con is the number of conversions, and cpa is the target CPA. This equation will be different in every campaign and may or may not be a simple affine equation. Because the total campaign cost is simply the number of conversions multiplied by the CPA, the projected weekly cost of the ad campaign in this example becomes:
cost = 0.11 × cpa2 + 9.34 × cpa
If you know how much your average customer is worth after any number of months, and you know how many conversions you’ll get at a target CPA and at what cost, you can combine all three to determine your projected contribution margin (gross profits less ad costs) attributable to an ad campaign. If we let CM represent the contribution margin, then we end up with the following:
CM = ltv × con – cost
The utility of this equation becomes apparent if you plot it with respect to CPA. Figure 3 shows a peak at which target CPA results in the highest predicted contribution margin attributable to a single week of ads. The longer you can wait to earn back ad spend with repeat volume, the more you can spend to acquire a customer. As a reminder, this example analysis is for a single campaign on Google Ads, and it reflects what the predicted outcome will be for a given target CPA setting in that campaign.
If the goal is to maximize profit in a period, you’d aim for a target CPA that hits the peak of the curve. In this example, if the goal is to be most profitable at six months, then the target CPA should be set to $243. On the higher end, if the goal is to be most profitable at 24 months, then the target should be set to $443.
On the other hand, if the goal is to grow as quickly as possible and break even on ad costs in a period (to result in even higher profits later), you’d set your target acquisition cost much higher, to where the gross profit curve crosses zero. If the goal is to break even at six months, then the target CPA would be set to $570. If the goal is to break even at 12 months, then the target would be $750.
It boils down to a tradeoff between rapid growth and cash flow. Maximizing long-term profit might mean spending more now at a short-term loss, with the understanding that your repeat customers will generate far more value over time.
These models aren’t necessarily predictive. Market conditions will change to make models like this obsolete over time. It’s important to experiment so that models can be corrected and optimized. We call that “exercising the model.” Even if ads are performing well, we “wiggle” spend settings up and down as often as weekly so that we can ensure that each campaign is performing as expected. If circumstances change, sometimes more dramatic campaign changes are needed so that new models can be created.
We’ve had well-behaved campaigns change basically overnight, where a nice affine curve like that in Figure 2 suddenly flatlined. We’d get the same mediocre results regardless of what we spent. We still don’t know why that happened, but it was a trigger to retire the campaign and move our dollars elsewhere.
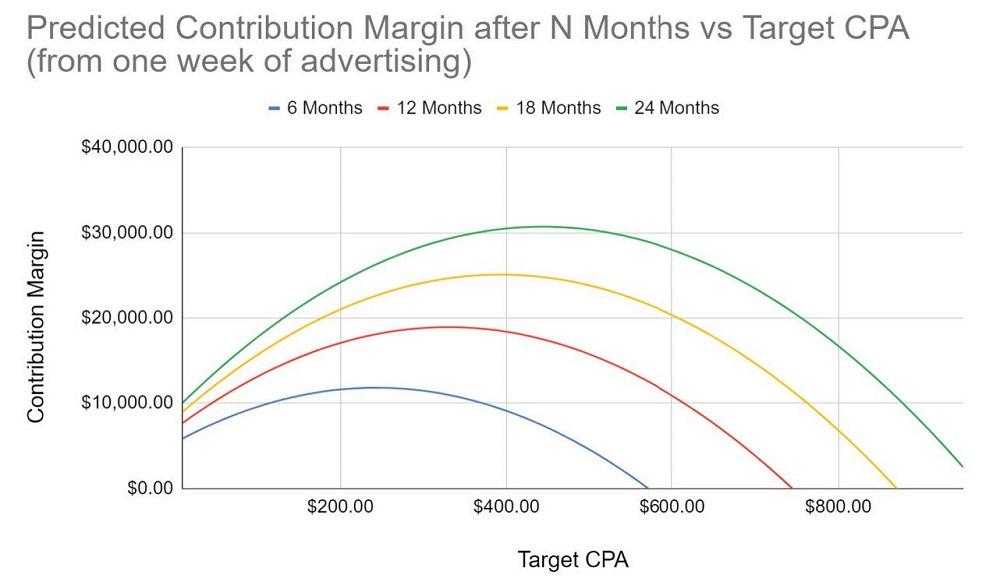
FIGURE 3. Tying an acquisition cost model to a customer value model allows contribution margin to be predicted based on a target CPA.
Also note that in manufacturing, where inside sales may carry a contract across the finish line, a digital ad “conversion” might simply represent a lead. To close the loop on the value of digital ads, you’ll need to understand your lead-to-order conversion rate and build that into the models.
The model I just described barely scratches the surface. Different ad platforms are set up and behave in different ways, so models must be built for each one. Data collection and attribution can also be tricky, especially when customers touch multiple campaigns across platforms during the acquisition journey.
Regardless, with rich data and incredible analysis tools at our fingertips, we definitely should know whether our ads are making money, how much, and when. Using mathematical models and deliberate experimentation enables ad campaigns that not only work but also produce predictable results that can be optimized with confidence. The practice takes much of the mystery and frustration out of advertising, with incredible results for both growth and profitability. You shouldn’t settle for anything less.


The Fabricator is North America's leading magazine for the metal forming and fabricating industry. The magazine delivers the news, technical articles, and case histories that enable fabricators to do their jobs more efficiently. The Fabricator has served the industry since 1970.
start your free subscription
Easily access valuable industry resources now with full access to the digital edition of The Fabricator.

Easily access valuable industry resources now with full access to the digital edition of The Welder.

Easily access valuable industry resources now with full access to the digital edition of The Tube and Pipe Journal.

Easily access valuable industry resources now with full access to the digital edition of The Fabricator en Español.
In this episode of The Fabricator Podcast, Caleb Chamberlain, co-founder and CEO of OSH Cut, discusses his company’s...