


Independent Consultant
For many fabricators, the classic wastes of lean manufacturing are mere symptoms of an underlying disease: an inefficient shop layout. A.R.E. Mfg. scaled everything to fit onto a Lego base plate.
In his now famous “Toast” video, Bruce Hamilton describes the seven primary forms of waste as identified at Toyota during the company’s remarkable 20th-century turnaround. Transportation, inventory, motion, waiting, overproduction, overprocessing, and defects (as well as an eighth form added in recent years, underutilization of talent) comprise the most recognizable forms of waste and are certainly worthy of our efforts to eliminate, but in my humble opinion, they are more symptoms rather than the disease itself.
Performing a root cause analysis on the 350 or so companies I have worked with, I’ve found that the underlying and recurring “disease” leading to the systemic forms of waste is often rooted in one diagnosis: a poorly designed facility layout. Hamilton alluded to this by saying something like, “Why is the machine where it is (causing the material or operator to move around a great deal)? Is it because that’s where the power is, or where there was space in the building on the day the machine arrived?”
To save the few hours of time it would have taken to identify the perfect location for a new machine, companies instead elect to pay in perpetuity the ongoing cost of waste and inefficiencies for misplacing a piece of equipment. Pretty short sighted.
A second and even more chronic cause of waste is the long-held belief that similar machines should be grouped together in a departmental arrangement. Departmental layouts might allow operators to share tooling and expertise, which is a plus. But departments also can be manufacturing islands unto themselves and are usually managed by supervisors whose performance is measured on their department’s output tonnage(or some other measurement of quantity), rather than a metric encouraging the flow of materials.
Material transportation and operator motion are not the only waste symptoms resulting from a poor facility layout. Due to the less-than-ideal distance between operations, many choose to process larger lot sizes over making multiple trips between operations. Overproduction ensues, and subsequent operations then must wait for material to be moved in a “perceived” economic batch.
Think back to the Bruce Hamilton Toast video, or about your own home kitchen. Imagine the folly of buying a new microwave and forever placing it in the living room because there is more shelf space available there on the day it is delivered. Thankfully, what has been done can generally be undone, and many of the 1,500 kaizen events I’ve facilitated have focused on diagnosing and surgically reconstructing decades of misplaced equipment choices.
It would be nice if we could take a magic pill to cure our shop layout ailments. Unfortunately, there is no overnight cure. Developing the “perfect” facility layout is not rocket science—but it is a science.
The first step is to perform a product quality routing (PQR) analysis. In so many words, you need to identify what you make, how many you make, which processes you use, and in which order they are used. The PQR analysis may be sorted in a number of ways: by material type, customer, product type, product size, or (most frequently) process requirements.
The PQR analysis identifies unique and significant value streams (see Figure 1). For instance, an improvement team at A.R.E. Mfg.—a contract fabrication and machining operation based in Newberg, Ore.—identified four primary value streams: (1) lathe work; (2) mill work; (3) fabrication work, including tubing and sheet metal; and (4) shared resources like sawing, powder coating, and assembly. From this, you can develop an interrelationship diagram for each value stream showing the percentage of flow between each key operation (see Figure 2).
In many cases, when trying to identify value streams, I get pushback from company owners who say, “We are not Toyota. Everything we make is unique. We don’t have distinct value streams!” True, no one is Toyota, but when I ask them: “Imagine that you are required to move out of this building and into three or four smaller buildings, perhaps in multiple cities. How would you divide the work?” This question usually helps them realize that there really is a way to identify families of products.
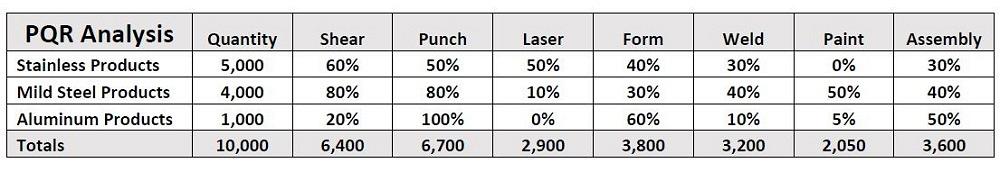
FIGURE 1. This product-quantity-routing analysis shows what percentage of products flow through specific processes.
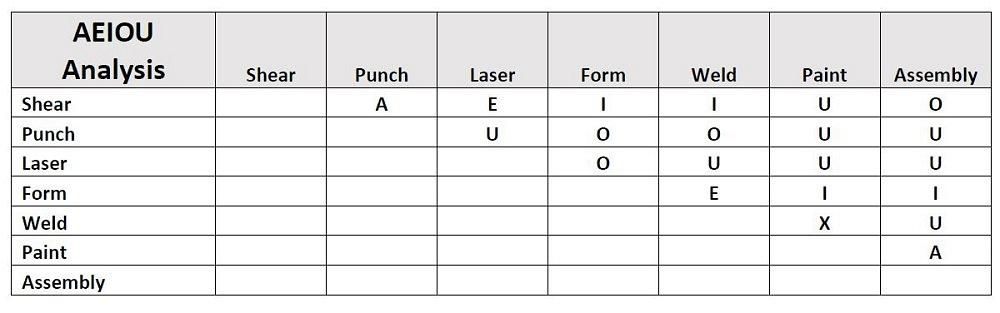
When PQR data is unavailable or difficult to obtain, you can try a technique that has proven itself many times over: the AEIOU matrix (see Figure 3). If material tends to move consistently between two processes on an hourly basis, then the relationship between those processes is A, absolutely important. If the frequency of product routings between operators is a daily rather than hourly event, then it may be E, especially important (but not absolutely critical). Weekly flow may be I, important; monthly routing events are probably O, of ordinary importance; and process relationships based on annual routings may be deemed U, unimportant. X stands for an unwanted connection. For example, welding and grinding paired with volatile chemicals or paint processes would be a bad idea.
You cannot successfully value-stream-map your entire company in one motion. Instead, you must map the value streams individually, identifying any shared resources that will need to be placed in a common area. Measuring the operator cycle times (OCTs) and (if the process can run without operator engagement) machine cycle times (MCTs) is critical to identify the number of operators and machines required. Setup times and yield are also important data points to gather to accurately calculate labor and machine requirements. Value stream mapping data can then be used to balance the line, develop standard work (who will do what), and position equipment in such a way that standard work can be accomplished without undue motion.
The next step is where the fun (and the healing) begins. Teams use the PQR, interrelationship, and AEIOU diagrams to begin brainstorming alternative flow patterns. Without thinking too much about the size of machines yet, and preferably without being overly concerned about the shape or size of the building, allow yourself to dream about the perfect flow of material through all value streams. I often ask teams to think about an empty field; perfect the flow first, then figure out how to fit that concept into the confines of the building.
The outcome may look like the conceptual flow shown in Figure 4—no scale models of equipment yet; simply a line drawing showing patterns representing potential flows for each value stream. It will certainly not capture every possible scenario, but if you focus on the 80/20 rule, it will likely provide maximum benefit 80% of the time. Don’t forget to consider shared resources (heat treating, powder coating, plating) that cannot be easily duplicated within each value stream.
If practical, try to think circular. A linear process flow makes it difficult for team members at opposite ends of the line to assist each other, but a circular shape (with operators inside the circle) permits work sharing, the ability to assist in machine setups, shorter travel distances, and improved communication.
I encourage teams to develop seven alternative flow patterns. The first few are easy; the fourth and fifth alternatives are more difficult to come up with; the sixth makes your brain bleed just a little bit. But if teams push past the logjam of ideas, forcing themselves to think outside the box, the seventh alternative is usually a breakthrough.
Taking a day-long break between development of the last few alternatives can provide time to germinate, meditate, and stimulate idea generation. When the ideas stop flowing, I attempt to kick loose the logjam by asking questions like: “How would you set this up for robots, or people in wheelchairs, or sight-impaired teammates?” We take advantage of the fact that most people are mobile—but robots tend to be stationary. Humans can move around, but it costs money to do so. Thinking outside the box can yield new, creative solutions.
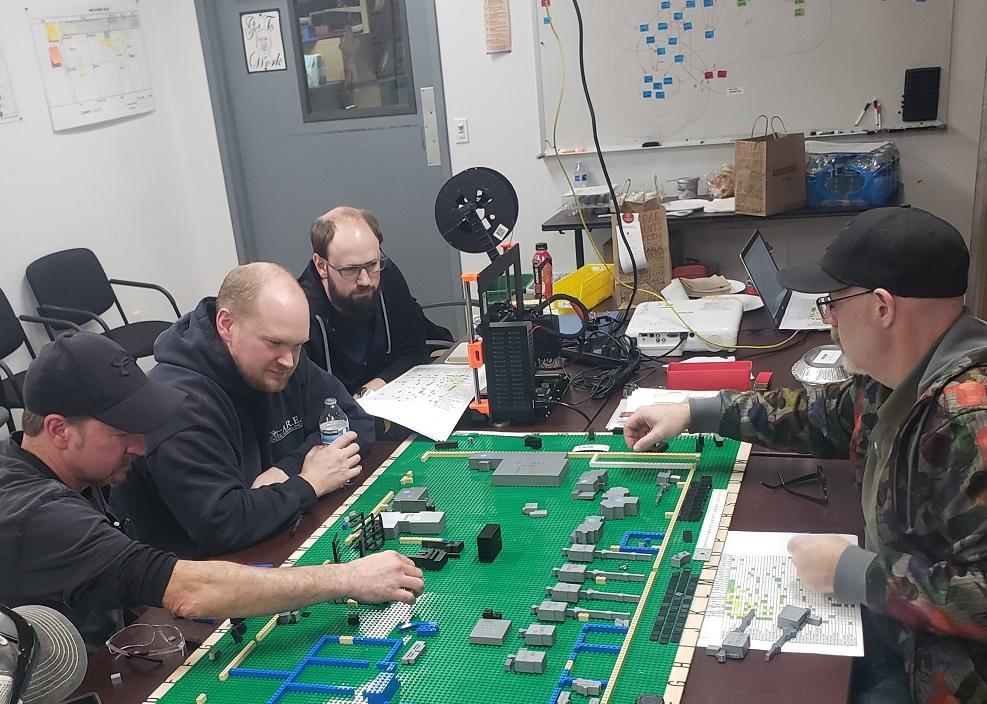
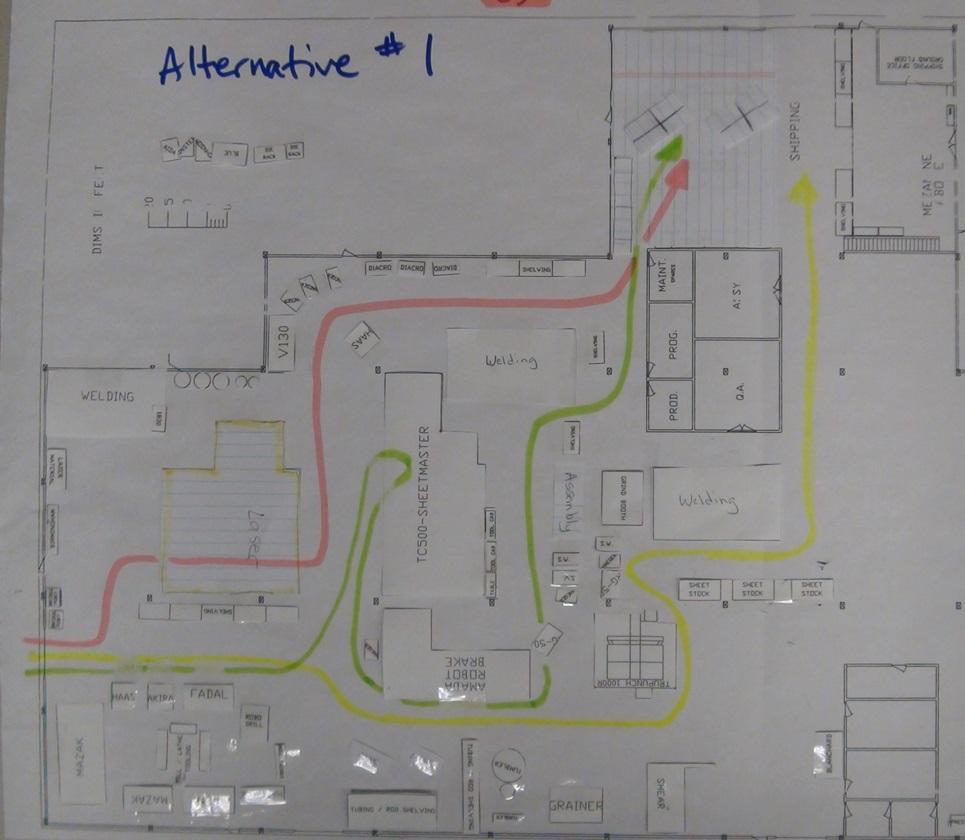
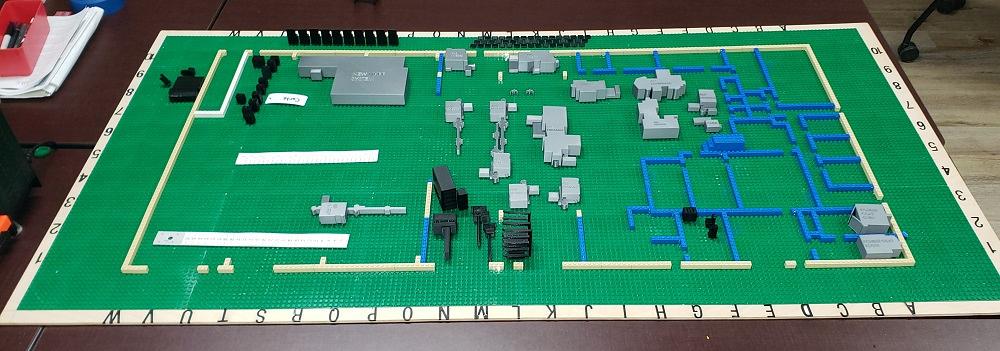
You can do this by simply putting pen to paper or by cutting out paper dolls that roughly represent the size of equipment or processes. As shown in Figure 5, the team at A.R.E. Mfg. used a 3D printer to produce scale models of every piece of equipment in the shop. They scaled everything to fit onto a Lego base plate. This allowed them to position and lock equipment into place easily, photograph alternatives, and then reposition the machines to represent additional ideas and options. Notice that the Lego board (or blueprint) is labeled like the old Battleship game, with letters on one axis and numbers on the other. This allows the current location of equipment and processes (the current state) to be documented and for the future-state location to be identified quickly.
For example, the current location of the press brake is at J-4, but its new position will be at G-6. This data can be placed right into the value stream map, making it easy to identify the current and future-state position of any piece of equipment.
Moving equipment can get expensive, and getting the layout right the first time is a critical objective. If at all possible, and if time allows, try to simulate or test the layout before moving equipment. As a consultant, I sometimes served as a “virtual” conveyor, hand-carrying material between operations to simulate the effect of two or more processes being side by side. This allowed us to identify and remedy any potential imbalances that would create bottlenecks in a new layout.
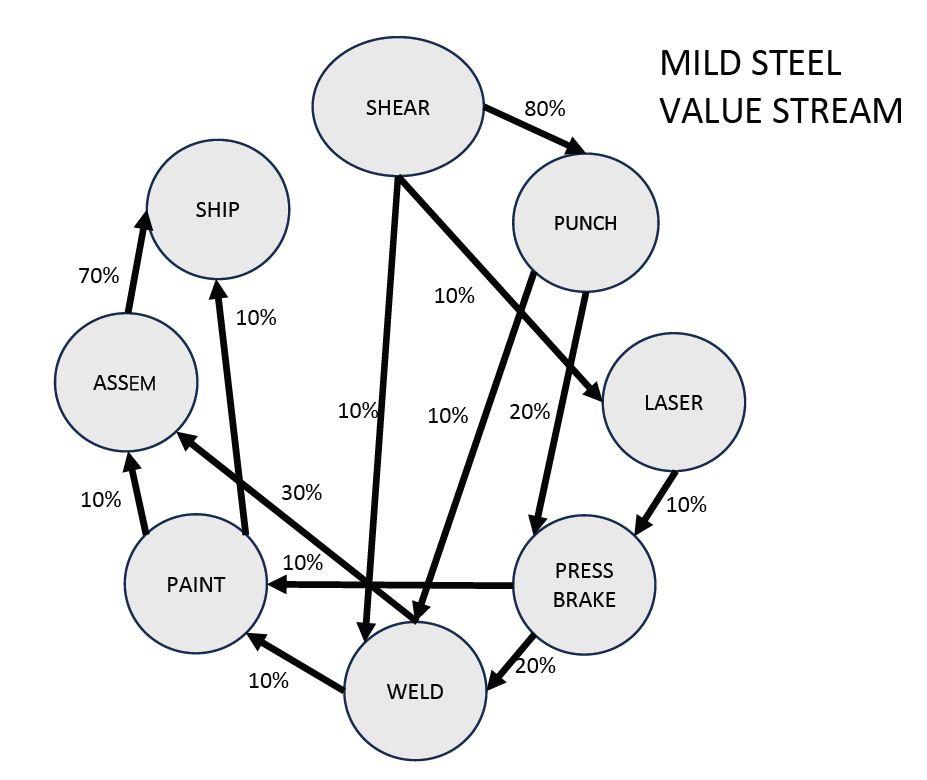
FIGURE 2. An interrelationship diagram shows the percentage of products that flow between specific processes.
As with the conceptual flow alternatives, try to generate at least seven alternatives to ensure that you have not left any stones unturned. Do not simply vote for your favorite block layout (since human nature is to vote for your own idea). You want the decision chosen to be the best decision for the business.
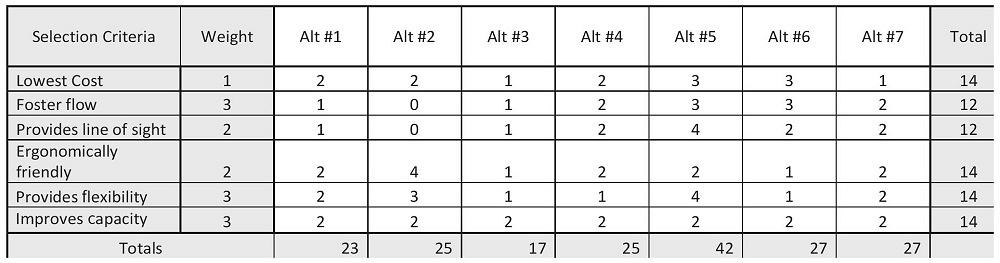
To that end, you can try a selection method called the PUGH matrix (see Figure 6), invented by Dr. Stuart Pugh. First determine the most important criteria to use in selecting a layout, then assign a weight (importance) to each, usually using a scale of 1 to 3. Multiply the number of alternatives by 2 (in this case, 7 alternatives × 2 = 14 points), then distribute the points across the alternatives, with the best option receiving the highest score. Make sure you don’t assign more than half the total points to any one alternative. Also, you do not have to assign any points if an alternative does not meet the selection criteria.
Multiply the score of each option against the weight of each criterion. Total each column and use this sum total to test whether the highest scoring alternative is truly the best option.
With the optimum block layout selected, you can now start a detailed layout. This includes identifying the exact location (feet, inches, and angle) of each machine; utility drops (or floor vaults) such as power, water, air, and networking requirements; workstation locations; material delivery and scrap removal; areas for forklift clearance; and space for preventive maintenance and major repairs.
Once you’ve finalized your detail layout, but before moving your machines, put together an action plan. It is not uncommon to have a floor-to-ceiling waterfall chart to describe the move sequence. Think of the move like a chess game. Moving the queen or king means first moving a pawn. Moving the air compressor may require moving the saw. Piece by piece and step by step, the move will happen, but planning it out like a chess game will pay dividends in avoiding collisions and unnecessary or redundant movements.
You never want to have to face a medical operation, but done right, that operation can improve your quality of life. While the thought of a major shop realignment might seem overwhelming, the result could foster flow, minimizes waste, improve the quality of “working” life, and greatly enhance morale.
From a financial standpoint, consider the following example: A $5 million company with 25 employees (assuming a $25 hour rate) has a poor facility layout that forces materials to move around a lot. All this results in a stark metric: About 30% of all activity doesn’t add value. An improved facility layout that eliminates just half of the non-value-added activity could yield $195,000 in labor savings.
The sales potential of that same 15% productivity improvement could be as high as $750,000 (15% of $5 million). Not having to buy more equipment to achieve a 15% jump in sales could contribute another significant gain.
Performing a complete reconfiguration of a facility requires significant effort, and you want the new layout to last as long as possible. The introduction of new products, equipment, or technological advancements may require machine upgrades. This usually happens quickly, leaving little time for diligent study of the effect upon flow. Discipline to repeat the steps described here will be the key to avoid drifting away from the target of world-class performance. Keep your eye on the ball, and remember, Taiichi Ohno said it best: “Sleeping parts make no money.”

Independent Consultant
The Fabricator is North America's leading magazine for the metal forming and fabricating industry. The magazine delivers the news, technical articles, and case histories that enable fabricators to do their jobs more efficiently. The Fabricator has served the industry since 1970.
start your free subscription
Easily access valuable industry resources now with full access to the digital edition of The Fabricator.

Easily access valuable industry resources now with full access to the digital edition of The Welder.

Easily access valuable industry resources now with full access to the digital edition of The Tube and Pipe Journal.

Easily access valuable industry resources now with full access to the digital edition of The Fabricator en Español.
In this episode of The Fabricator Podcast, Caleb Chamberlain, co-founder and CEO of OSH Cut, discusses his company’s...


