


Head of the Mathematical Modeling Department of Engineering & Technology Center
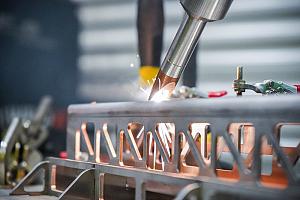
Stresses induced by cross-rolling cause fissures to appear in the center of the feedstock, a solid billet; a mandrel exploits this phenomenon, turning the billet into a tubular product. Modern finite element simulation software helps to optimize this process.
In the decades since computer-aided design (CAD) software began to displace slide rules, engineering firms have benefited greatly from the reduced development time for new products. Lengthy and laborious calculations became the domain of the software, freeing up engineers’ time to create more products or refine existing ones. Meanwhile, process simulation software gave engineers another tool, one that assesses and verifies the capabilities of processes and process variations.
The finite element method (FEM) is used widely by industrial plants to simulate manufacturing operations, including metal forming operations. While FEM has gained broad acceptance in industry, many simulation programs traditionally focus solely on workpiece deformation, treating the tooling as rigid. However, for forming processes that involve large contact forces between the workpiece and tooling, the accuracy of the predicted stresses and strains typically improves when the software considers the tooling to be deformable. Using such systems makes the development of new products easier and reduces costs, allows forecasting out-of-specification conditions, and helps to identify possible risks in the forming operations.
The staff at Vyksa Steel Works, Vyksa, Russia, was researching software packages to help it analyze its cross-rolling processes when it found QForm, a finite element code that evaluates many manufacturing scenarios, including cross-rolling. The software uses a Lagrangian mesh for predicting the deformation of pliable bodies, including tooling.
The staff at Vyksa sought a process that would simplify the manufacturing of some of its products, specifically by reducing a two-pass process to a one-pass process. An accurate software simulation would help the staff to determine whether the equipment could handle the additional stress and whether the product quality would be satisfactory.
The simulation process used by the program is a three-stage process.
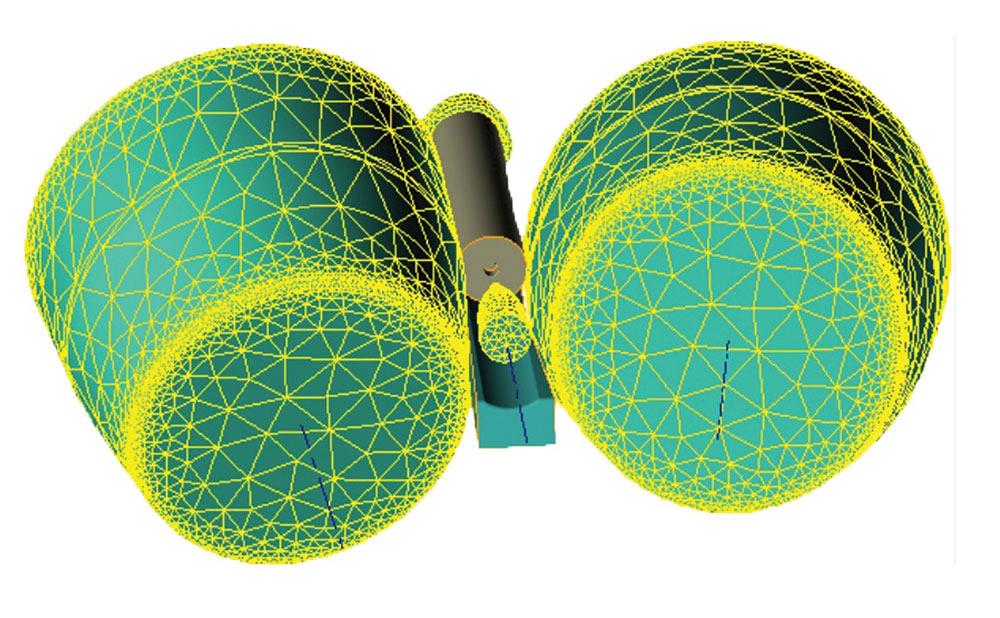
In the first stage, the draftsman or engineer uses a CAD system to create 3-D models of the tools and the workpiece and exports them to QForm, which prepares the model by positioning the solid bodies relative to each other, eliminating any existing geometric defects, meshing the models, specifying the axes and the rotation directions of rolls, and setting any necessary symmetry properties (see Figure 1).
In the second stage, the user adds specific material properties and parameters that define the forming process, including boundary conditions and initial conditions such as temperatures and velocities. After supplying this information, he launches the analysis; the software uses a system of partial differential equations that simulate plasticity.
In the last stage, a postprocessor examines the predictions. Typical parameters analyzed include contact areas, stress and strain tensors, velocity fields for deformable materials, temperatures of the workpieces and tools, tool reaction forces, and the final workpiece shape. The postprocessor also identifies any calculation failures, if applicable.
For simulations of the piercing process associated with cross-rolling, the results of interest include the geometric parameters of the shells, helicoid line steps on the outer workpiece surface, piercing machine time, billet twist in the roll gap, and predictions of surface waviness.
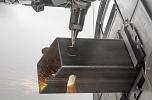
Billets, Mills, and Forming Forces. Vyska Steel Works uses a piercer mill built by EZTM, model TPA 70–270, to produce hot-rolled seamless products that subsequently are used to make pipe couplings for casing and tubing. The input is a hot-rolled or continuously cast round billet from 80 to 250 millimeters (3.15 to 9.84 inches) OD; the output is a pipe from 70 to 270 mm (2.76 to 10.63 in.) OD in wall thicknesses (w.t.) from 8 to 28 mm (0.31 to 1.10 in.). The conventional process consists of two passes. After cross-rolling and piercing the billet to create a hollow in the first pass, the machine operators change the settings of the rolls and guides and replace the piercing plug with a larger one for the second pass (see Figure 2).
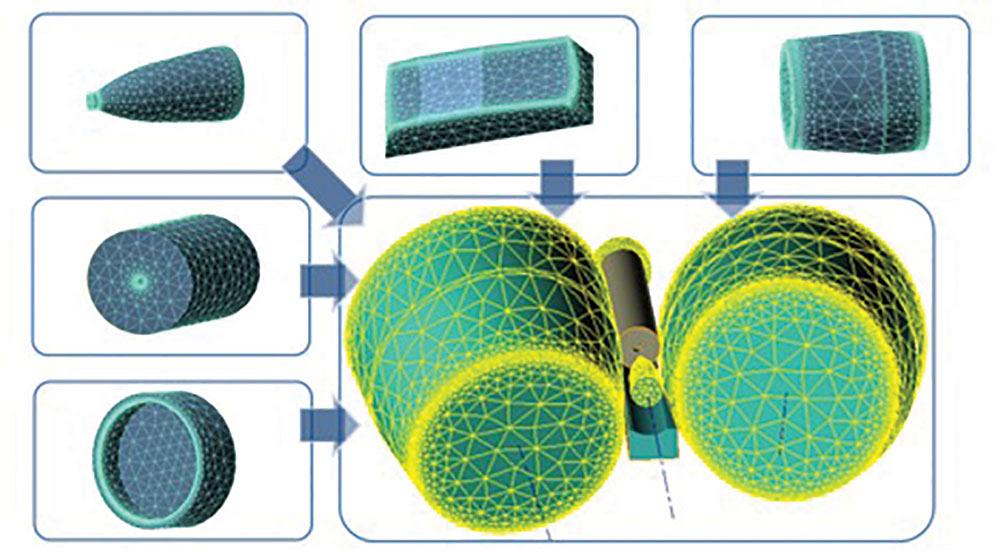
Figure 1
Simulated items consist of five components (listed from bottom left and proceeding clockwise): pusher (ram), workpiece, mandrel, guide shoe, and work roll.
The simulation was based on the following criteria:
The simulation relied on several assumptions—specifically, that the tools are rigid, that the friction coefficient is isotropic and constant throughout the entire simulation process, and that heat transfer between the workpiece and tool is a factor, but not a complex one because this heat transfer takes place only in a thin layer of the workpiece.
Planning to Pierce. The simulations considered two billet and product sizes:
The simulation was conducted to determine the machine settings—distances between roll pairs and guide shoes, plug location, and roll rotation speed—that would use a single pass allowing an OD deviation of ±1 percent and a w.t. deviation of ±10 percent. Maximum w.t. variation on a single pipe was not to exceed 3 mm (0.118 in.). Doing all of the work in a single pass would put more stress on the machine components, so the simulation had to take into account the machine’s rigidity.
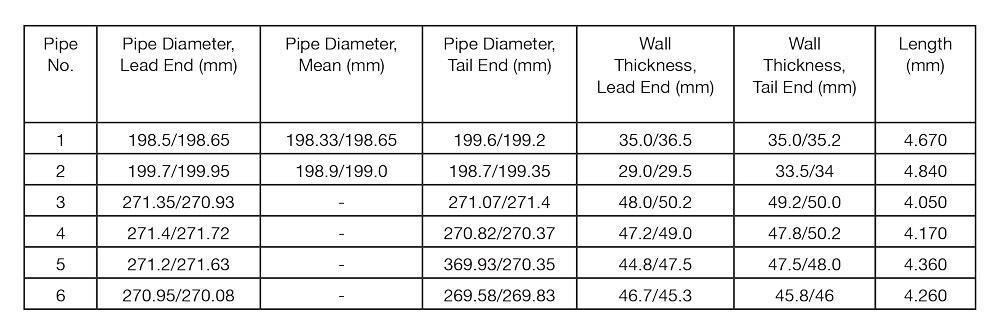
The experiment comprised of making tube from four of the larger billets and two of the smaller billets. To facilitate adjustments, the operators measured the OD and w.t. of each hot shell on the run-out table. Measurements were made by a Vernier caliper about 500 mm (20 in.) from the leading ends. The final dimensions were measured at three points (leading end, center, and tail end) after sizing and cooling.
To assess the thickness variations, the staff took OD and w.t. measurements at nine or 10 cross-sections, at 500-mm intervals, after the shells had been sized and cooled. The diameter was an average of two perpendicular directions and the wall thickness an average of four. The thickness in this case was measured by an ultrasonic thickness gauge.
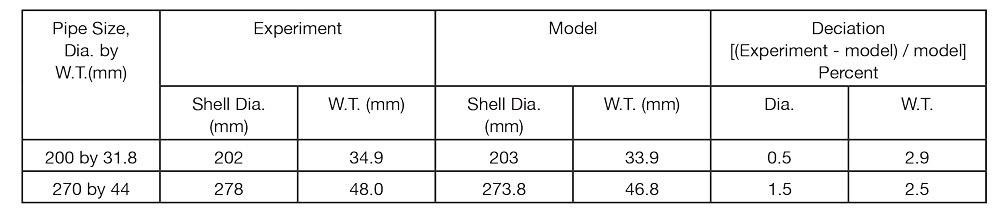
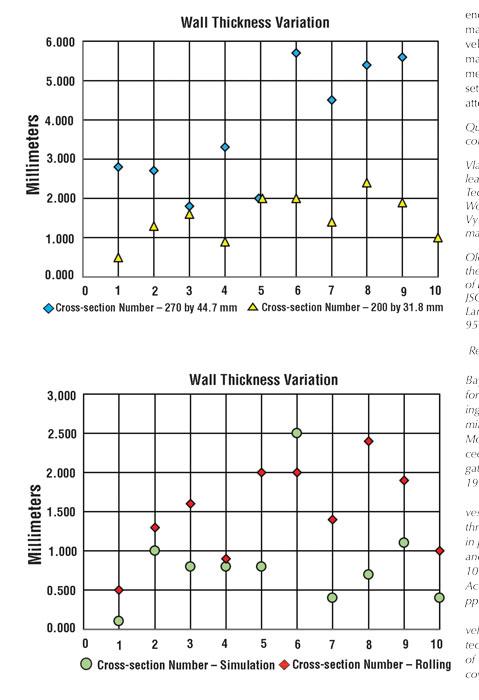
Analyzing the Results. The measured values concur well with the predictions (see Figures 3 to 6). The relative errors of the OD and w.t. do not exceed 1.5 percent and 2.9 percent, respectively. It should be noted that the estimated shell thickness is always a bit thinner than the actual one.
The value of wall thickness variation estimated by the software was approximately 1.5 to 2.0 times lower than the actual values. This can be explained by idealizations inherent in the computer models. Such conditions include:
An important factor is the relative positioning of the tools and the workpiece in the deformation zone. Linear positioning errors may be on the order of 1 mm (0.040 in.) While shape problems like waviness and thickness variations are predicted by the simulation software, they are lower than the actual values. This is due to the simulator’s tendency to underestimate the significance of vibration amplitudes of interacting bodies. In actual practice, the position along the length of the workpiece has been shown to have a significant impact on the magnitude of such defects, which is not seen as strongly in the computer simulations.
An optimal element size and an optimal integration time step may improve the accuracy of the simulation results; however, mesh refinement and reduction of the time step can lead to a dramatic increase in the overall computational cost, which may become unacceptable in some cases.
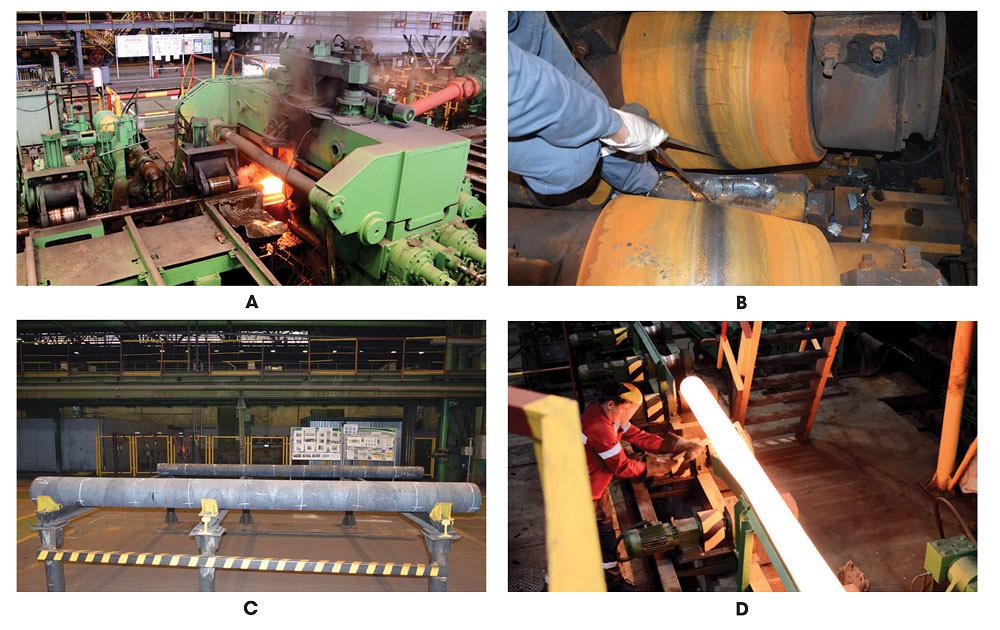
Figure 2
Figure 2
The simulation entailed cross-rolling and piercing on a TPA 70-270 built by EZTM (A). Deformation zone adjustments were carried out to optimize the output (B). Pipe evaluations included measurements after it had cooled and in the hot condition (C and D).
The engineering staff compared the calculated and actual values of piercing torques and power at the steady-state phase of deformation, both of which were higher in the calculation than in the actual process (15 to 20 percent higher for the torque and 5 to 7 percent higher for the piercing power).
The differences between predicted and measured values of these parameters most likely result from inaccuracies in workpiece properties, including its temperature and friction coefficient values. Comparison of rolling forces was not possible because the stands of TRP 70-270 are not equipped with measuring cells, but rolling torque can be estimated by measuring the main drive current.
The model represents nonsteady-state deformation conditions of the end sections of the workpiece realistically from a qualitative point of view. It predicts shape deviations such as flares and sink marks at the leading and trailing ends of the shell
A comparison of calculated and actual values concerning energy and force parameters (inputs) and dimensional parameters of the shells (outputs) found that systematic deviations of dimensions and tolerances are of the same order. These values can assist in determining the actual setup parameters.
Note that the estimated values of energy and force parameters for the observed cases are approximately 20 percent higher than actual values. Such error is acceptable, and in fact desirable in that it provides a safety factor.
The main reason for these errors is the uncertainty of the model input data; these are unlikely to be diminished at the existing conditions. The typical finite element size must be of the same order as the tolerance for the linear dimensions of the pipes.
In summary, the simulation’s predictions match the actual output closely enough to provide useful guidance in machine setup, allowing engineers to develop new products (and the processes to make them) while compressing development timelines and avoiding the costly setbacks associated with trail-and-error attempts.
QuantorForm Ltd., market@qform3d.com
Vladislav Mikhailovich Maximov is a lead specialist of the Engineering & Technology Center of the JSC Vyksa Steel Works, 6/60 Centralny Microdistrict, Vyksa, Russia 607060, 7-83177-95461, maksimov_vm@vsw.ru, www.vsw.ru.
Oleg Stanislavovich Khlybov is head of the mathematical modeling department of Engineering & Technology Center of the JSC Vyksa Steel Works, 5/12 Krasnye Zori Lane, Vyksa, Russia 607060, 7-83177-95417, hlybov_os@vsw.ru, www.vsw.ru.
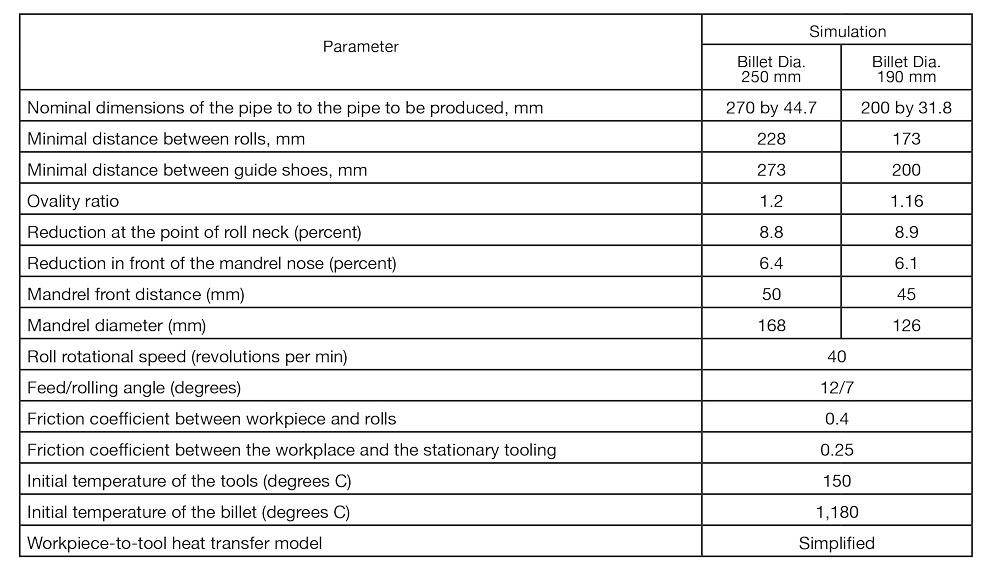
Figure 3
The software relied on a large number of operational parameters—the main ones are listed here—to determine outcomes such as the ovality ratio and dimensional reductions (shown here) and variations in diameters and wall thicknesses (shown in Figure 5 and Figure 6).
References:
V.V. Kalmykov, I.N. Ananyev, and O.F Bayramov, “Calculation of energy and force parameters and formability at rolling in the roughing stands of hot strip mills by finite element method,” Bauman Moscow State Technical University Proceedings, # 412, Machines and aggregates of the metallurgical production, 1984, pp. 57-67.
A.A. Voskanyanc and A.V. Ivanov, “Investigation of screw cross rolling by a three-dimensional finite element model,” in proceedings from all–Russian scientific and technical conference devoted to the 100th anniversary of the member of the Academy of Sciences A.I. Tselikov, 2004, pp. 332-340.
A.S. Aleshchenko, “Research and development of the methods for designing technological tools for cross-roll piercing of hollow shells and pipes,” Diss. Moscow, 2010.


The Tube and Pipe Journal became the first magazine dedicated to serving the metal tube and pipe industry in 1990. Today, it remains the only North American publication devoted to this industry, and it has become the most trusted source of information for tube and pipe professionals.
start your free subscription
Easily access valuable industry resources now with full access to the digital edition of The Fabricator.

Easily access valuable industry resources now with full access to the digital edition of The Welder.

Easily access valuable industry resources now with full access to the digital edition of The Tube and Pipe Journal.

Easily access valuable industry resources now with full access to the digital edition of The Fabricator en Español.
Seth Feldman of Iowa-based Wertzbaugher Services joins The Fabricator Podcast to offer his take as a Gen Zer...


