


Senior Editor

Ater a significant rebound from historic lows during the Great Recession, capital spending levels in metal fabrication kept somewhat steady, heading a little upward with the boom in mining and commodities, downward as those booms ended, all the while mitigated by strong results in automotive, recreational vehicles, and elsewhere. While specific machines, like the fiber laser, have had significant sales boosts, overall capital spending in fabrication hasn’t changed too much—until now.
That’s the takeaway from the “2018 Capital Spending Forecast,” published by the Fabricators & Manufacturers Association, presented by insurance provider CNA, and released at the FABTECH® tradeshow in Chicago last month. Overall projected spending for 2018 jumped to more than $2.7 billion, the highest level seen in years and 20 percent higher than the forecast for 2017. Spending in most equipment categories is set to rise, some dramatically so.
Many in fabrication are optimistic about 2018, and the forecast spending levels reflect that optimism.
A “big company” in metal fabrication is still considered a small enterprise in other sectors. Thousands of shops with fewer than 20 employees dominate this business. Having 200 to 500 employees makes a fabricator a major regional player.
All the same, spending among those shops has shifted significantly during the years since the Great Recession. Medium-sized fabricators have driven much of the spending. Projected spending for 2018 among fabricators employing between 250 and 500 employees is more than $507 million. Those employing between 100 and 249 are projected to spend more than $490 million (see Figure 1).
This makes sense when you consider broad industry trends. Large OEMs continue to streamline their supply chains, relying on fewer (usually larger) shops to provide more fabricated products.
By their very nature, larger shops have an easier time mitigating risk. Case in point: A $4 million contract would be important for any fabricator but a truly massive growth opportunity for, say, an $8 million shop. Canceling that contract would sting a large fabricator but could outright kill a small shop.
This isn’t to say small shops aren’t buying anything. They certainly are. Shops with fewer than 50 employees make up more than a fifth of all expected spending for 2018. That’s no small amount, especially when you consider the cost of modern equipment. But according to the latest survey, they’re not the epicenter of spending in metal fabrication.
The motives—why fabricators purchase—revealed in the study also indicate shifting trends. “Increase capacity” has always been a dominant reason for shops to purchase equipment, but close behind this year is the replacement of old equipment. It’s the most significant reason very large fabricators are choosing to spend. These companies need machines for the same reason their customers need fabricated parts. Equipment, be it farm machinery, a car, or a laser cutting machine, eventually wears out and needs to be replaced.
In this survey sample, more shops came from Texas than anywhere else—even more than Wisconsin, Illinois, Indiana, Michigan, and Ohio, the “ring of metal fabrication” near the Great Lakes. Yet when the survey looks at the actual dollar amounts plants are planning to spend, Texas doesn’t even make the top 10. This implies that in some states, fewer, probably larger shops are buying more.
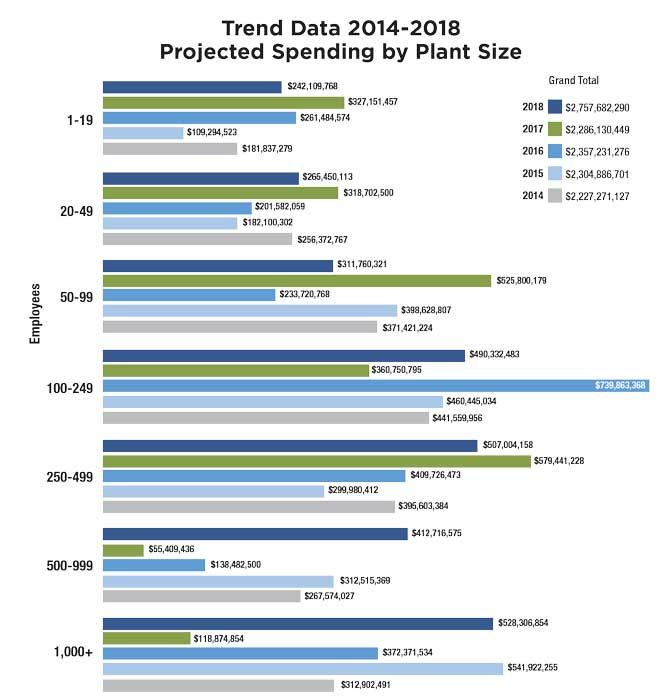
Figure 1
Spending among larger industry players continues to increase.
Note that the nature of the survey sample almost certainly played a role in this. A different statistical sample would have given different results, though probably not dramatically so. The strength of certain regional markets probably played a role too, like the health of automotive in the Rust Belt versus the oil and gas sector in Texas.
But it’s hard to overlook the overarching trend: More spending is becoming geographically concentrated. The top 10 states, as ranked by dollars spent, make up nearly 70 percent of the total projected spending for next year (see Figure 2). The top three states alone—Michigan, Illinois, and Wisconsin—account for more than a third of total planned spending.
More than 87 percent of survey respondents said that new equipment will make up the majority of their spending next year. That’s a big jump from prior surveys, and it jives with broader industry trends. Manufacturing technology is advancing rapidly, and new machines far outpace older ones. Buying old technology often just doesn’t make business sense.
Spending in welding tops the list, as usual, and the jumps in spending are significant (see Figure 3). Projected consumables spending is up 17 percent, which is an indirect measure of how busy shops expect to be next year. The more consumables shops consume, the more they produce. Welding power supply spending is up by 14 percent. And because the amount of spending is so large in welding, such spending bumps have an outsized effect on the overall spending number.
The greatest shifts in projected spending are in bending and cutting. First comes the expected: the growth in solid-state laser sales. The current projection of more than $226 million is up almost 40 percent from 2017’s projection. To put this in perspective, this is just $3 million less than the 2014 projection for both CO2 and solid-state lasers.
Next comes the less expected: the rebound in CO2 laser cutting machine spending. The projected $120 million for next year is up more than 22 percent from the 2017 projection. The old laser cutting standby may not have the sales it once did, but it’s not down for the count either. There may be good reason for this: It’s a mature technology that still excels at cutting plate.
Plate fabricators in general seem to be ramping up their spending. Plasma cutting systems could have a big uptick next year, with projected spending up 26 percent. Waterjet spending is up 23 percent, plate roll spending up 28 percent.
Among all the equipment categories, hydraulic press brakes stand out. Projected spending is more than $216 million. That’s the highest in recent years, and nearly as much as the 2014 projection for all laser cutting equipment. That’s saying something, considering the cost of a laser versus a press brake.
The increased spending dollars may point to the rising popularity of high-end press brakes with touchscreen controls, offline bend simulation and programming, and perhaps even automatic tool change capabilities. These aren’t your father’s press brakes. Expected spending on electric press brakes is up 21 percent, and spending on press brake alternatives seems to be rising as well, up 22 percent from 2017 projections.
Since the Great Recession, the nature of metal fabrication technology has driven new trends in equipment spending. Much of it likely started with skyrocketing laser cutting capacity.
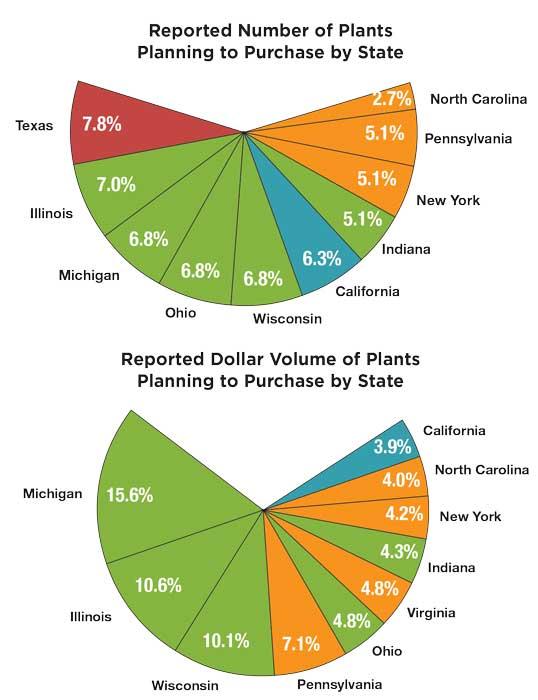
Figure 2
The 2018 spending forecast revealed high geographic concentration of spending, especially when broken down by dollar volume (bottom).
One high-power fiber laser can cut thin stock (which makes up a lot of the fabrication market) extraordinarily fast, and in so doing can feed a host of bending machines downstream. That in turn may be driving more spending on high-end press brakes, panel benders, and folding machines. (Though the lack of experienced press brake operators is also playing a role.)
Then all these parts need to be welded, often using flexible robotic systems, particularly in larger operations. Spending on robotics and automation in general is on the rise, especially in shops with more than 500 employees.
Like any survey, this one gets its numbers from a statistical sample. The latest report is based on more than 430 responses from a survey sent in September. FMA uses algorithms to turn the raw data numbers into projections that estimate industrywide spending.
But more than previous years’ surveys, the 2018 forecast seems to be overwhelmingly positive. At this writing (in November 2017), barring any black swan event, financial crash or otherwise, capital spending in metal fabrication is looking healthier than ever.
A complete copy of the “2018 Capital Spending Forecast” is available at the FMA store, www.fmanet.org/store.
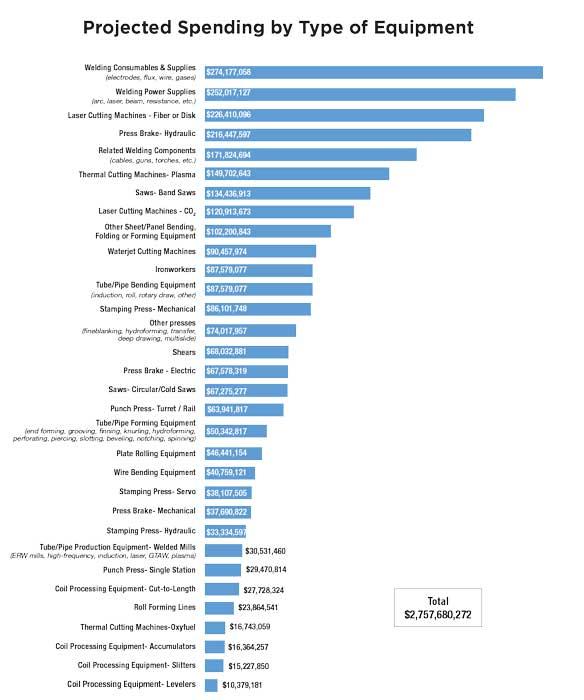
Figure 3
Overall projected spending for 2018 is up 22 percent.


The Fabricator is North America's leading magazine for the metal forming and fabricating industry. The magazine delivers the news, technical articles, and case histories that enable fabricators to do their jobs more efficiently. The Fabricator has served the industry since 1970.
start your free subscription
Easily access valuable industry resources now with full access to the digital edition of The Fabricator.

Easily access valuable industry resources now with full access to the digital edition of The Welder.

Easily access valuable industry resources now with full access to the digital edition of The Tube and Pipe Journal.

Easily access valuable industry resources now with full access to the digital edition of The Fabricator en Español.
In this episode of The Fabricator Podcast, Caleb Chamberlain, co-founder and CEO of OSH Cut, discusses his company’s...