The ROI of lean manufacturing
How metal fab shops can calculate the financial impact of continuous improvement

What’s the return on investment for continuous improvement for precision sheet metal shops? Can it be quantified? Getty Images
From my early days working in a precision sheet metal shop and through my career as a lean consultant, I frequently have found it challenging to convince finance teams to allocate funds for continuous improvement projects. They understandably want to see, if not an immediate payback, then a rapid return on investment (ROI).
Is it possible to estimate accurately the potential value of a setup-reduction project? Can you calculate the likely financial impact of 5S or a kaizen event? Is there a way to determine how much money could be saved by developing a facility layout focused on improved material flow? And after a project, can you verify the estimates and measure the actual impact of the project? The answer to all these questions is, Yes, you can.
Where It All Started
I have always considered myself an idea generator. At work I’ve always looked for ways to improve a process, even long before I knew anything about lean manufacturing. Working at that sheet metal company long ago, I’m sure I irritated my boss as I knocked on his office door time and again, asking for permission to try one of my harebrained ideas.
One time in particular was after some customers began asking that each component we produced bear a part number, revision level, our company initials, and the date of manufacture. This meant that every time I set up a new part on my turret punch, I was required to change the part-marking tool. I had to drive two pins out of the punch holder, allowing all the metal letters and numbers to drop out of the housing. Then I would gather all the correct letter and number punches for the next part, rebuild the tool, measure and adjust the stroke length based on material thickness, test-stroke the letter stamp, inspect the results, check for deformation, adjust as necessary, and finally run the job. All this took about 10 minutes.
My idea was that my boss should buy a second letter-stamp tool so that I could set it up while the previous part was still running. Of course, his answer to my question was in the form of a question: “How much will this tool cost?” “$650,” I replied sheepishly.
Since we had seven turret punches, he quickly calculated the total cost of outfitting each machine with an auxiliary letter-stamp tool: “$4,550? I can’t do that!” That was an all-too-familiar response.
Thankfully, that is not the end of the story.
A couple of days later I spied my boss, calculator in hand, walking through the shop toward my machine. We made small talk for a few moments. He then asked me about the letter-stamp tool.
“Tell me again, how long does it take to set up that tool?”
“10 minutes,” I replied.
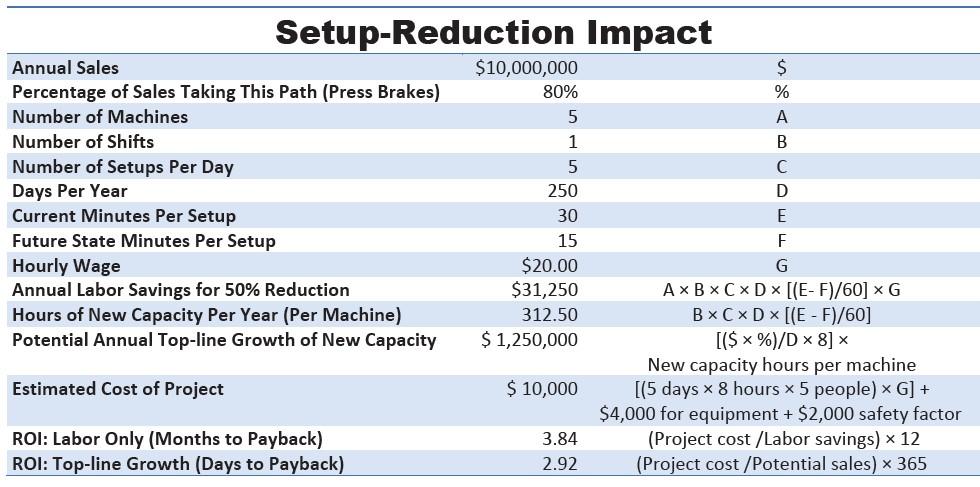
FIGURE 1 This shows the financial impact of a press brake setup-reduction project.
“How many times a day?”
“Ten to 12 times a day, sir.”
“And you’re not the only one doing that—each of these six other machine operators are doing the same?”
“Right.”
He turned to his calculator. “Ten minutes per day, 10 times per day, times seven machines, working three shifts. Why, that’s 2,100 minutes per day that these machines are not producing parts, just because everyone needs to change over this letter-stamp tool. That is 35 hours, almost one week’s production for one machine.” He pointed to my machine. “Do you have any idea how much money this machine generates per hour in revenue when it is running?”
I shrugged and shook my head.
“Thirty-five hours of lost production time at $65 per hour means we are leaving $2,275 on the table every day! We can pay for those tools in two days. In a year we could gain over half a million dollars in additional capacity.”
I could not hide my smile of satisfaction. Without knowing it, my boss did me the greatest favor of anyone in my career. He could have sat in his office and done the calculations on his own and purchased the tooling without any further input from me. But he saw this as a teachable moment. And since that moment, I never went to my boss again with an idea without being prepared to show the financial benefit.
That five-minute MBA lesson gave me (and any team I was working with) the ability to look at any process and determine the ROI of any idea. Working first as a lean coordinator and then in my private practice as a lean manufacturing consultant, I found it absolutely necessary to quickly calculate and communicate what the financial impact of a project might be.
To that end, I built a simple spreadsheet that I could use right on my smartphone as I performed a shop walk-through. Based on years of experience as well as anecdotal and hard data, this simple tool helped me give management teams an accurate estimate of the cost and benefits for some of the most common continuous improvement projects.
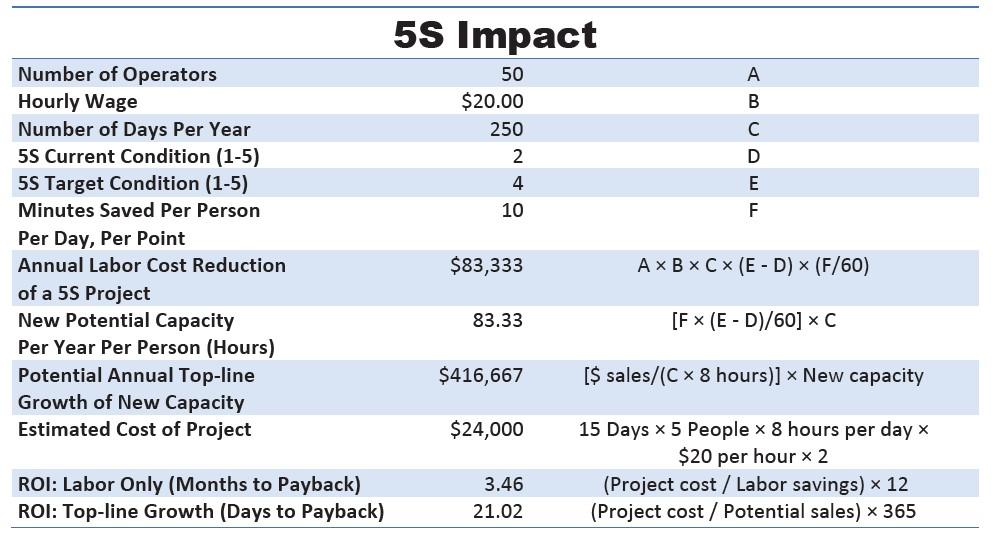
FIGURE 2 This shows how to determine the financial impact of a 5S project. The 5S “current” and “target” conditions show the grade (1 through 5) received on a 5S audit.
It is certainly not rocket science, but it is a science. A simple spreadsheet is all that is necessary. The spreadsheet has values that are both variable and constant. And this spreadsheet is free. (Information on how to obtain a free copy is at the end of the article.)
The ROI of Setup Reduction
Based on decades of experience, I can tell you that most machine setups can be reduced by more than 50%. Simply by reorganizing the work area, developing standardized practices, applying a water-spider (setup assistance) strategy, and performing offline (pre-setup) activities, you can eliminate half of the machine downtime.
Say you implement a press brake setup-reduction project. First, you need to gather some variable data. Let’s assume your company has $10 million in annual sales. Eighty percent of your product moves through five press brakes, which are operated over one shift. Average setup time (gathering materials, paperwork, tool changes) is 30 minutes, and you have about five setups per day. Now, let’s assume you shorten your average setup time from 30 to 15 minutes. The chart in Figure 1 shows how to calculate the ROI.
A typical setup-reduction project on press brakes takes between three and five days with a team of three to five people. It might require some additional tooling, point-of-use storage, and the development of standard practices and setup sheets. All this requires less than 200 hours of labor for the kaizen team, or about $4,000. The cost of carts, duplication of a few tools, modification of tool storage, provisions for improved tool retrieval methods, and other elements of the project bring the total cost estimate to $8,000. Round up to $10,000 just to be on the safe side, and you’ll find it’s still a bargain compared to the ongoing cost of 30-minute setup times.
Dividing the $10,000 into a $31,000 “labor only” benefit means that this project would have a 116-day (3.8-month) payback. Based on new sales potential of over $1.2 million (potential new top-line growth), this project could pay for itself in a little over three days. In a nutshell, a project like this provides roughly the same capacity as buying another press brake.
I operated a press brake in our sheet metal shop for nearly 12 years. We had complex parts with up to 25 bends, both obtuse and acute. Our setups averaged 36 minutes and included logging in and out of the job on our job tracking software system; gathering cardboard to interweave the parts; gathering material and paperwork; determining through trial and error which tools to select; storing, retrieving, and installing the tools; programming the controller; adjusting the program; getting the quality assurance department to approve the first article; and processing the paperwork at the beginning and end of each job. By identifying the value-added portion of the setup and assigning a water spider (a person to gather material, paperwork, and any other necessary but non-value-added activities), we were able to reduce our machine downtime from 36 minutes to 6 minutes.
Setup reduction became critical because our clients were demanding smaller and smaller lot sizes. For one customer, we produced monthly batches of 600 computer cabinets. Each cabinet had 80 different sheet metal components, which meant we had to perform 80 setups a month, each of which took us 36 minutes. This meant we were spending about 48 hours each month setting up our press brakes. Across five press brakes, we had 800 available hours per month—but 6% of that time (48 divided by 800) was spent just setting up the machines.
At one point the customer told us they would need weekly batches of 150. Shipping once a week instead of once a month effectively quadrupled the number of setups. We previously shipped one batch of cabinets; and again, each cabinet had 80 different components, giving us 80 setups a month. Now we had to perform 80 setups a week. This meant that 24% of our available time was now being spent setting up our machines. Pretending to be a small-lot manufacturer was eating our lunch.
Oh, by the way, this was only one customer. We had at least two dozen other major customers to take care of at the same time, all of whom were beginning to see the value of smaller lot sizes.
Setup reduction was not optional. It was necessary for our survival. Once we figured out how to do it, we became the premier sheet metal shop in our area. No one could touch us. It was like a race car team being able to perform a 12-second pit stop while the competition was spending minutes in the pits. In the end, we estimated that our team saved $800,000 per year by adopting Toyota’s SMED (single minute exchange of dies) approach—or in our case SDED, single-digit exchange of dies. Our setup time average was less than 10 minutes.
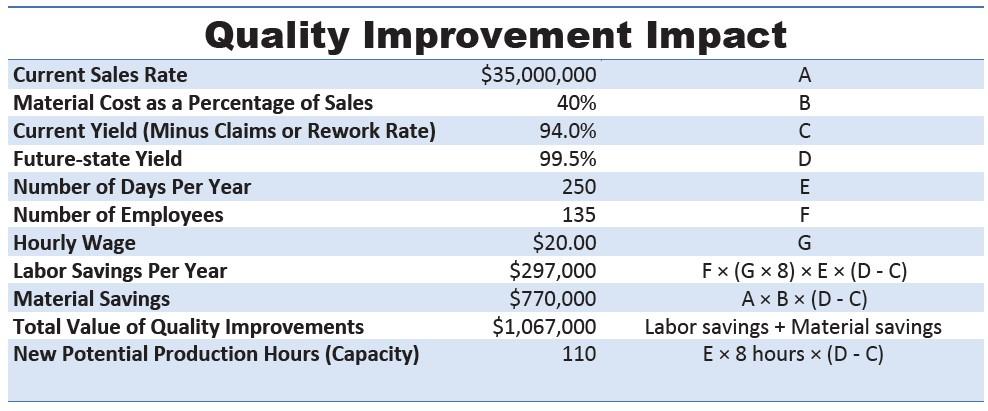
FIGURE 3 This shows how to measure the financial return of a quality improvement project.
For most precision sheet metal shops, setup reductions in their press brake, turret punch, and hardware areas are the lowest-hanging fruit in terms of rapid ROI and capacity improvement. Yet even after showing managers case studies and demonstrating the remarkable savings potential of setup reduction, many hesitate to fund projects.
I could have made a very respectable six-figure salary facilitating nothing but setup-reduction projects in exchange for 10% of the project savings. For the previous example—which, again, saved $31,000 in labor costs alone—the total savings would have netted me a $3,100 payday for one week’s work. If tied to the net profit of $1.2 million in top-line growth, a pay-for-performance bonus could have meant an additional $6,000, based on 5% of $1.2 million ($60,000) and assuming 10% of that value being my bonus.
Setup reduction, 5S, total productive maintenance, and facility layout projects all can contribute to the bottom line by minimizing or eliminating the seven primary forms of waste: transportation, excess inventory, unnecessary motion, waiting, overproduction, overprocessing, and defects. Eliminating these allows employees to contribute and more fully utilize their talents.
The ROI of 5S
I’ve probably performed as many 5S projects as setup-reduction projects. So how can you possibly calculate the financial benefit of a clean, organized workspace? You start with the 5S audit. Based on a 1 to 5 scale, each workspace is observed and measured in relationship to five questions per the “S” category—sort, set in order, shine, standardize, and sustain.
When operators find items within arm’s reach—with shadow boards and dedicated locations for material, tools, and paperwork—they spend minimal time searching and they can shave minutes off every activity. History shows that for every “point” gained in the 5S audit, operators tend to save 10 minutes per day.
Consider Figure 2. If the initial audit results in a finding of “2” and the condition after the 5S event is determined to be a “4,” then operators can theoretically save 20 minutes per day. When multiplied by 50 people, that adds up to 16.6 hours per day of new capacity plantwide and 83 additional productive labor hours per year for each person. They’re not working more hours, they’re just spending more of their working hours actually producing. This freed capacity could avoid the cost of hiring two new people.
Say the company sells $10 million a year. Broken down, this means that on average it sells $5,000 every hour. Eighty-three hours of new capacity holds the potential for selling an additional $400,000. A $10 million company becomes a $10.4 million company—all from 5S improvements.
ROI of Quality Improvements
Quality improvement projects can also yield remarkable financial results. A project with a $35 million casting company netted more than $1 million. The company produced titanium and cobalt components for artificial hips and knees. The process on the shop floor involved dozens of activities, each with dozens of variables. The Six Sigma project team identified more than 200 process variables using a technique called quality mapping. In doing so, the team found the root cause of a 6% waste rate, traceable to cracked molds (see Figure 3).
Considering only the cost of the labor necessary to remanufacture scrapped parts, 6% of wages for the company’s 135 employees equaled more than $300,000 in wasted labor. Added to that the cost of materials, lost opportunities, and the time spent on rework, the total money saved added up to more than $1 million.
The ROI of Lower Employee Turnover
Sometime near the end of 2004 I was invited to work with a 60-employee precision sheet metal shop with serious turnover problems. The company had 100% turnover every year. Twenty of its longer-term employees tended to stay an average of six years, but the remaining 40 staff members came and went. Company leaders had no idea how much this revolving door of employment was costing them.
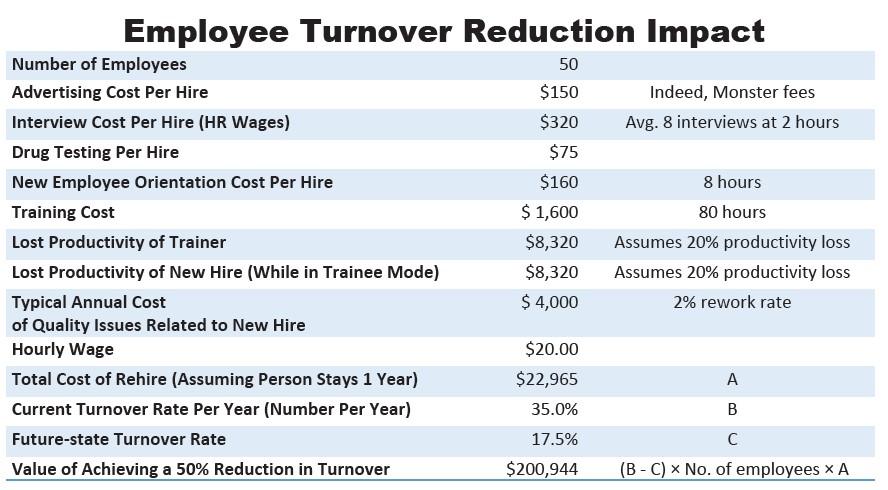
FIGURE 4 This shows the savings of reducing 35% employee turnover at a 50-person company. Such a turnover rate means the company is replacing between 17 and 18 workers every year. If the total cost to replace a worker is $22,965, the total cost of turnover companywide is more than $400,000: 22,965 × (50 × 0.35).
There is much debate around the true cost of losing and replacing an employee. So much depends on the departing employee’s length of employment and the level of difficulty in finding and training a replacement. One line of thinking is that it costs roughly a third of a person’s salary to replace them if they have been with the company for a year or longer. Therefore, to replace a $30,000-per-year employee, you might expect to spend $10,000. But I needed a much more robust, scientific, and logical method of showing this company the true cost of losing a trained staff member. So, I turned to the spreadsheet.
Consider the numbers in Figure 4. They show the savings of a 50-person employer that reduces its turnover rate from 35% to 18%. The cost of interviewing, drug testing, and training needs to be accounted for. As the numbers show, the total cost of a 35% turnover rate for this company is more than $400,000. Lowering turnover by about half, to 18%, reduces the companywide cost of turnover to a little more than $200,000.
How much would you be willing to pay to cut the ongoing cost of turnover in half? After all, you’re paying for turnover already. Say you make an investment to create meaningful entrance and exit interviews, incentives, bonuses, supervisory and team training, and recognition programs. All that might add up to $1,000 per person. For a 50-person company, that $50,000 investment could begin to change the culture and reduce turnover. A 50% reduction could net $200,000 in savings.
Lean Can Be Quantified
Just like my boss did for me way back in 1986, teach your team members to think like a businessperson. Take time, work with them, and show them how to calculate the value of their ideas. Their working life will become more enriching, and your company and their jobs will become more sustainable. By having everyone thinking about how valuable each minute of the day can be, the seven forms of waste will become a daily target for your entire team.
Gary Conner provides consulting services through the Oregon Manufacturing Extension Partnership, www.omep.org. He is a two-time Shingo Award-winning author of books on lean manufacturing, including several about the small shop environment. He can be reached at LinkedIn. [ www.linkedin.com/in/gaconner.]
This article covers only a portion of the ROI calculations available on the spreadsheet. The spreadsheet isn’t locked, so you can adjust it to meet your company’s needs. To obtain a free copy, email Gary Conner or Senior Editor Tim Heston. To access a video tutorial, click here.
About the Author
About the Publication
subscribe now
The Fabricator is North America's leading magazine for the metal forming and fabricating industry. The magazine delivers the news, technical articles, and case histories that enable fabricators to do their jobs more efficiently. The Fabricator has served the industry since 1970.
start your free subscription- Stay connected from anywhere

Easily access valuable industry resources now with full access to the digital edition of The Fabricator.

Easily access valuable industry resources now with full access to the digital edition of The Welder.

Easily access valuable industry resources now with full access to the digital edition of The Tube and Pipe Journal.

Easily access valuable industry resources now with full access to the digital edition of The Fabricator en Español.
- Podcasting

In this episode of The Fabricator Podcast, Caleb Chamberlain, co-founder and CEO of OSH Cut, discusses his company’s...