


Managing Director of Projects, R&D
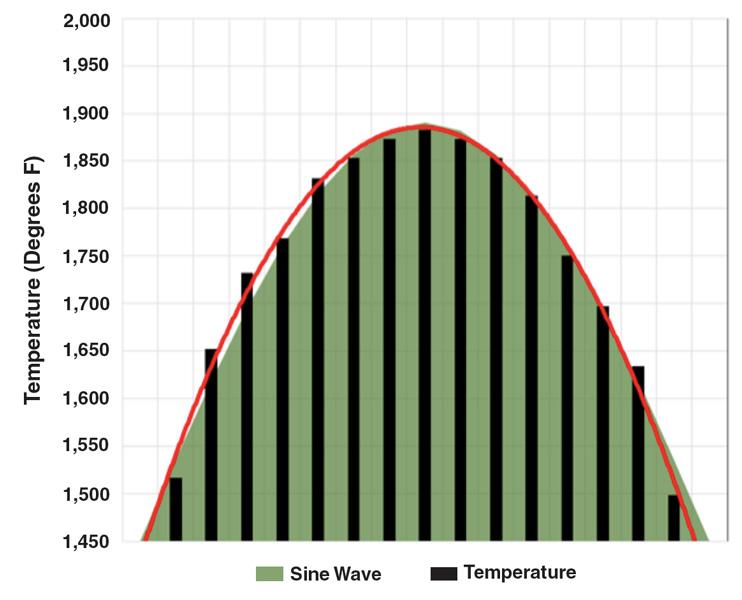
Figure 1
Thermography measures temperature distribution across the width of a weld seam, recording a peak temperature at the center and falling temperatures to the left and right of center (black columns). The red line shows the temperature distribution trend and the green area shows a theoretically perfect temperature distribution, a sine wave. The thermography camera is sensitive enough to detect these small differences.
Editor’s Note: This article is adapted from “In Line Testing with Thermography in Tube Lines as an Alternative to Eddy Current,” presented by Volker Schauder at Pipe & Tube Houston 2014, sponsored by the Tube & Pipe Association International® and the International Tube Association, Houston, Sept. 16-18, 2014.
The thermal processes used to join metals, such as plasma, induction, laser, and gas tungsten arc welding (GTAW), have improved since they were developed, and they get better with each passing year. However, no industrial process is perfect, so companies that conduct research in flaw detection likewise continue to develop and improve the technologies used to verify weld integrity: ultrasonic testing (UT), eddy current testing (ET), hydrostatic, X-ray, magnetic particle, and liquid penetrant are among the most common.
Two of these are used for verifying the integrity of the continuous welds such as those used on pipe and tube mills: UT and ET. Each uses a transmitter to send waves of ultrasonic energy or electrical current through the material and a receiver (probe) to detect disturbances in the flow. The two processes often are combined to capitalize on the strengths of each. While ET is good at detecting flaws at or near the surface, UT penetrates the material, detecting subsurface flaws.
One drawback is that sound waves and electrical current waves have a specific direction of travel, or an alignment. A linear defect that runs parallel to the direction of travel of the ultrasonic sound wave or a flaw that is parallel to the coil winding direction of the ET probe can go undetected. A second drawback is that they don’t detect cold welds.
An alternative process, thermography, works in a different fashion: It monitors the heat of the material as the weld cools. Although it measures the heat at the surface, the heat signature provides clues about cooling activity deep in the material, resulting in a thorough assessment of the weld’s integrity. It can detect too much heat, too little heat, and unusual heat signatures.
As the word implies, thermography evaluates the heat at the weld seam, monitoring it for intensity, distribution, and changes in these characteristics. This cannot be done visually. Arc welding processes generate such an intense, focused arc that the human eye cannot monitor it. The glare from the heat obscures all of the useful visual information. Conversely, the high-frequency induction process puts the heat into the material; the heat at the surface is too insignificant to evaluate with a visual system.
Thermography relies on a technology that can deal with the vast amount of light generated by the arc, and it can measure heat that is put into the material by induction. It isn’t impeded by the fumes and spatter that contaminate the environment, and it is small enough to work in the confined space near a tube or pipe mill’s weld box.
Existing thermo-cameras were evaluated for this application, but weren’t found to be sensitive to the wavelengths a typical welding arc generates (less than 2 µm). They also typically don’t have a fast enough frame rate (more than 400 images per second). Pyrometers are excellent for measuring temperature in a specific spot, but they don’t measure the broad area of the heat-affected zone (HAZ). Also, they measure just one aspect, temperature, but they don’t measure temperature distribution.
This led to the development of a new type of thermo-camera. Compact and robust, it is a lens-free device that measures temperatures between 0.6 and 12 in. (15 and 305 mm) from the sensor. It gathers temperature distribution data over a path wide enough to capture information across the entire HAZ (see Figure 1). Because it has a scan frequency of 400 profiles per second, it is suitable for line speeds used for induction welding, typically 600 feet per minute (FPM). Of course, this means it can handle laser and arc welding applications, which typically weld at 50 FPM.
The scanner uses three shields to protect it from weld smoke and spatter: a gas shield, a mechanical safety shutter that closes if the gas pressure falls below a threshold, and an antispatter shield. An optional self-cleaning system can be used for severe environments. The camera is water-cooled to protect it from elevated temperatures.
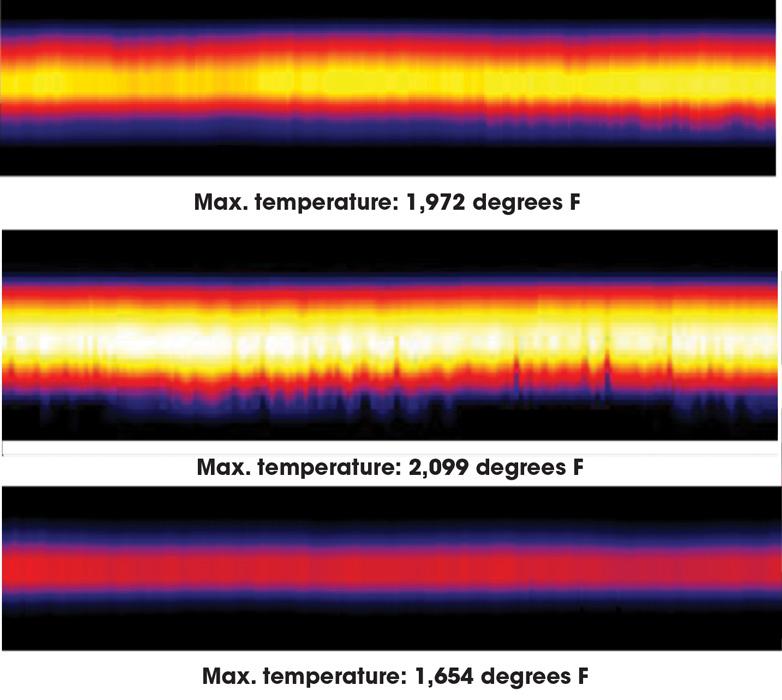
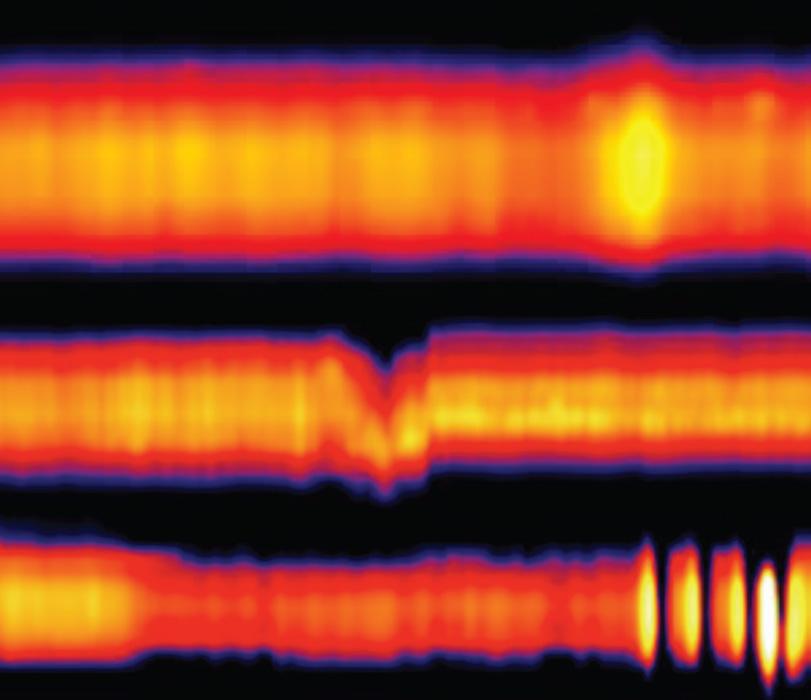
Figure 2
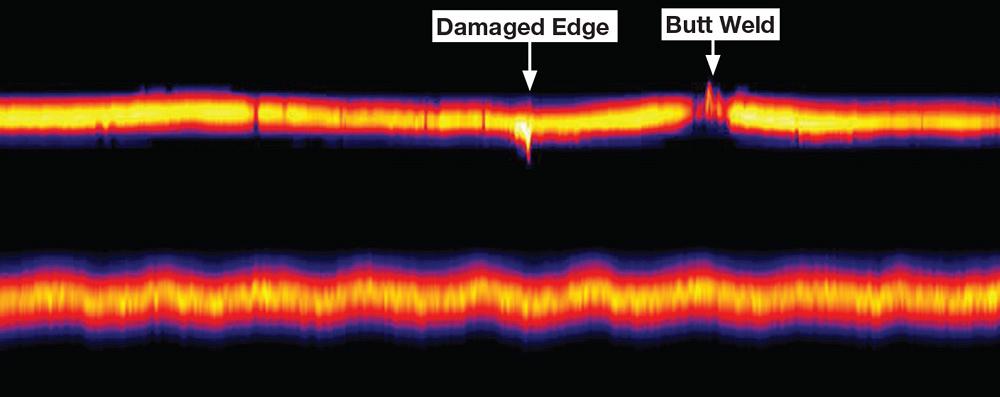
A normal welding temperature display shows a band of high temperature at the center, in yellow, flanked by orange, red, and blue as the temperature falls (top). A wide band dominated by yellow indicates too much heat (middle). A dark, narrow band indicates a cold weld (bottom).
The user interface displays two results, data and a graphic representation of the weld. The data consists of maximum temperature, width of temperature zone, temperature symmetry, profile position, and form differences. The graphic representation shows the weld zone as it progresses past the camera. The center portion is brightest, usually a shade of orange, which darkens to red and finally blue at the edges of the weld area. An anomaly, such as a sudden change in color or width, signifies a defect.
Every recorded value is compared to a reference (threshold) value so the system can alert the operator to any data reading that doesn’t conform to preset thresholds. The error signal also triggers a spray unit to mark the defective length of pipe.
Much more important is the system’s alerting capability. By sounding an alarm, it alerts the operator to stop the mill and find the source of the trouble before producing any more scrap. The system also enables the operator to monitor the parameters continuously and optimize the mill’s parameters, preventing small problems from turning into flaws that wouldn’t pass inspection.
The spray unit also numbers the lengths of tube or pipe that pass the inspection, and the computer triggers the saw to cut the appropriate lengths.
As the weld cools and solidifies, heat flows through the base material. This is thermography’s chief application in tube and pipe production—it measures the temperature at the surface. Because the surface temperature is a result of the heat exchange process as the weld cools, thermography lets the operator understand what is happening beneath the surface.
A chief asset of thermography is its ability to provide precise temperature measurements, which helps to prevent the most basic weld problems: too much or too little heat (see Figure 2).
Thermography also detects problems that are specific to the various welding processes. For GTAW applications:
For induction welding applications:
For laser welding applications:
A common concern when using a testing or verification process is its sensitivity. The higher the sensitivity, the more capable the system. A lateral change of 0.0008 in. in the weld head position results in a temperature difference of 140 degrees F, which the scanner can detect. This is enough sensitivity to detect even slight changes and disturbances in the welding process.


The Tube and Pipe Journal became the first magazine dedicated to serving the metal tube and pipe industry in 1990. Today, it remains the only North American publication devoted to this industry, and it has become the most trusted source of information for tube and pipe professionals.
start your free subscription
Easily access valuable industry resources now with full access to the digital edition of The Fabricator.

Easily access valuable industry resources now with full access to the digital edition of The Welder.

Easily access valuable industry resources now with full access to the digital edition of The Tube and Pipe Journal.

Easily access valuable industry resources now with full access to the digital edition of The Fabricator en Español.
In this episode of The Fabricator Podcast, Caleb Chamberlain, co-founder and CEO of OSH Cut, discusses his company’s...

