


Graduate Research Associate - Center for Precision Forming
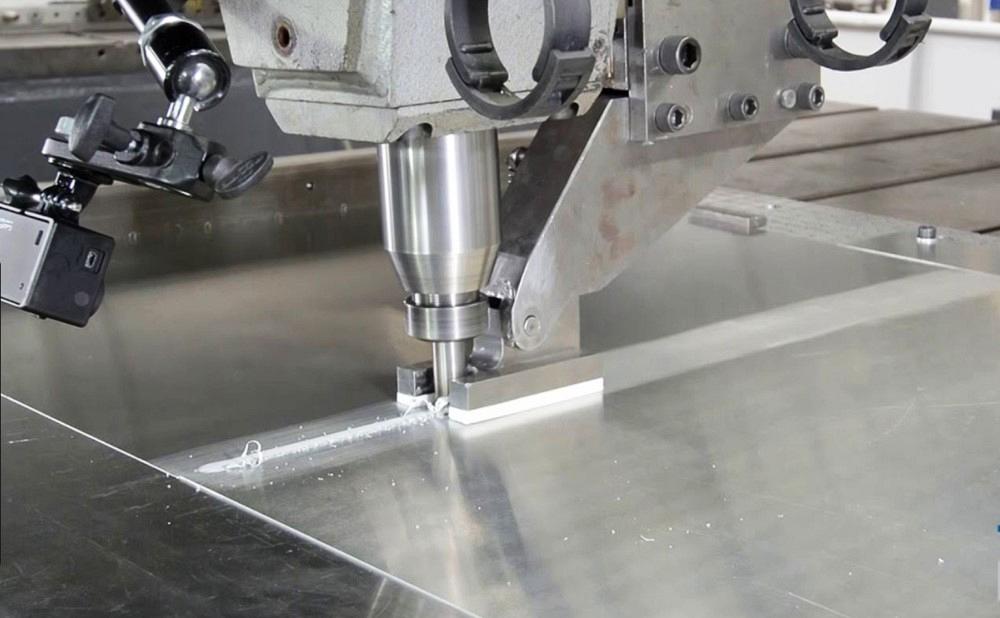
A tailor welded blank (TWB) is made by butt/lap welding, typically with a laser, two or more sheets of different thicknesses or alloys to form a multigauge or multialloy blank. Getty Images
Editor’s note: This is Part I of a two-part series that discusses the methodology for evaluating the formability of tailor welded blanks using tensile test experiments and finite element simulations. Part II will discuss simulations of plane strain, limiting dome height, and hydraulic bulge tests to evaluate formability.
A tailor welded blank (TWB) is made by butt/lap welding, typically with a laser, two or more sheets of different thicknesses or alloys to form a multigauge or multialloy blank. The use of TWBs can eliminate many subassemblies by substituting them with one stamped component. When used for automotive parts, TWBs can be designed to achieve targeted strength in required areas only, saving overall vehicle weight.
A TWB’s formability depends on weld quality, so welding parameters must be optimized. Additionally, during the laser welding of steel, heterogeneous material structures develop across the weld region, which can influence the performance of a TWB.
Researchers at The Ohio State University’s Center for Precision Forming performed a study to determine the input material parameters for finite element (FE) simulations of TWBs using tensile tests. The monolithic (no weld) material and welded samples for this project were provided by a partner company, and it was assumed that weld quality was as good as could be obtained.
The monolithic material was 1.2-millimeter-thick galvannealed draw quality aluminum killed steel. The TWB was made by laser welding two sheets of monolithic material, each 1.2 mm.
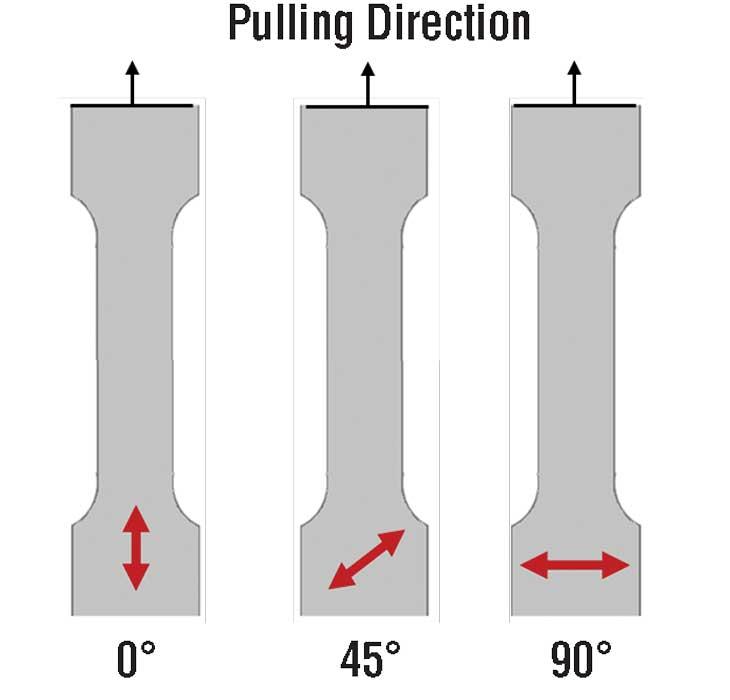
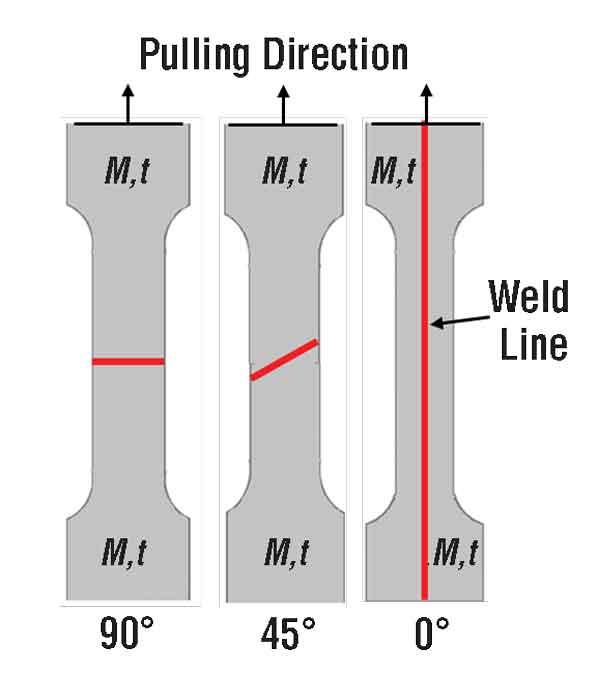
Researchers tested three samples for each monolithic (see Figure 1) and TWB (see Figure 2) configuration. They used a GOM Aramis 6M 3D camera system to perform digital image correlation (DIC) to determine the strain distribution.
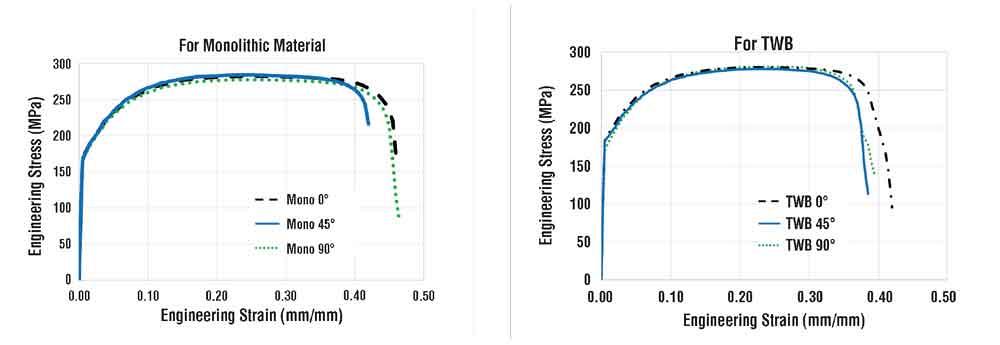
Researchers obtained load-stroke curves for the monolithic material and TWB by coupling the results from the tensile test and DIC, then converted the results to engineering stress-strain curves. Each curve (see Figure 3) represents an average of three samples.
Uniform elongation varied from 26.0% in the rolling direction to 24.5% in 45 degrees to rolling direction for the monolithic material. The uniform elongation in the TWB decreased to 24% in 0-degree TWB and 23.5% in 90-degree TWB. There was no significant difference observed in ultimate tensile strength of the monolithic material and the TWB.
Researchers obtained the flow stress curve and the mechanical properties for the monolithic material from the tensile test results and used them as an input for monolithic materials:
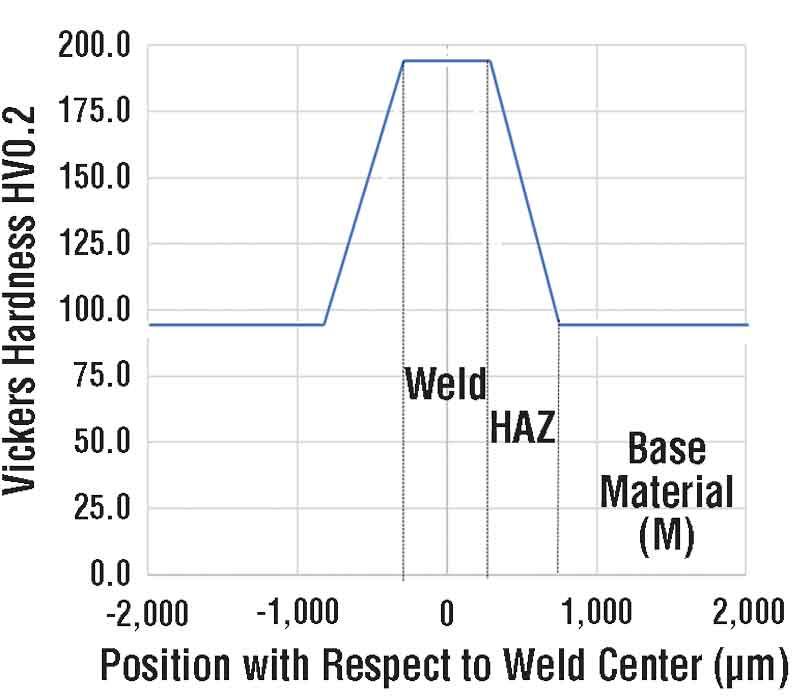
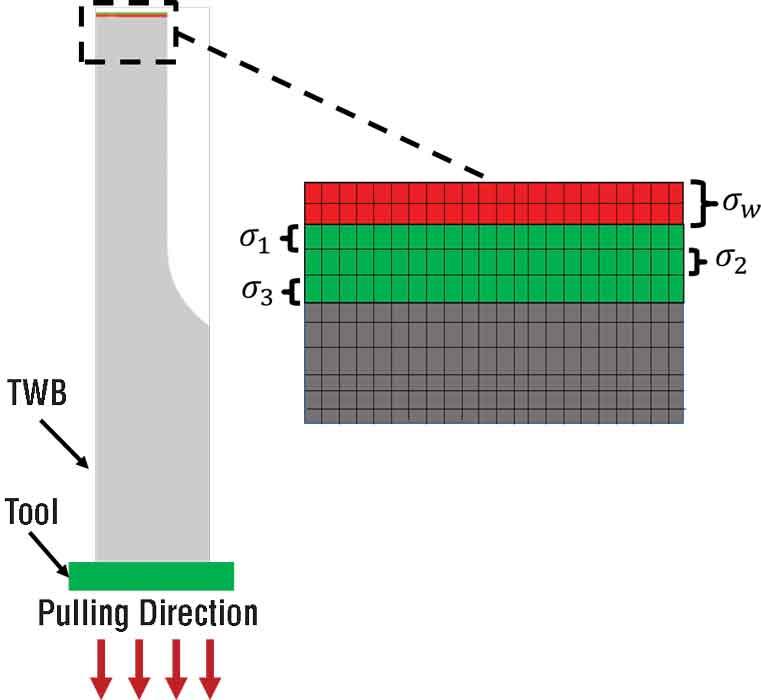
Using DEFORM-3D software, researchers conducted FE simulations with three elements along the thickness of the sample (to evaluate thinning effectively). With hardness measurements, they obtained the width of the heat-affected zone and weld zone (see Figure 4) and then assigned the mechanical properties for the weld and HAZ (see Figure 5). They input constant flow stress values for the HAZ and weld zone and assigned three different flow stress values to the HAZ to ensure a smooth decrease in flow stress values from weld to base material.
A comparison of the engineering stress-strain curves from the experiments and FE simulations indicated that a good match was obtained (~2% difference) until the start of necking in the sampled, monolithic, and TWB 90 degrees.
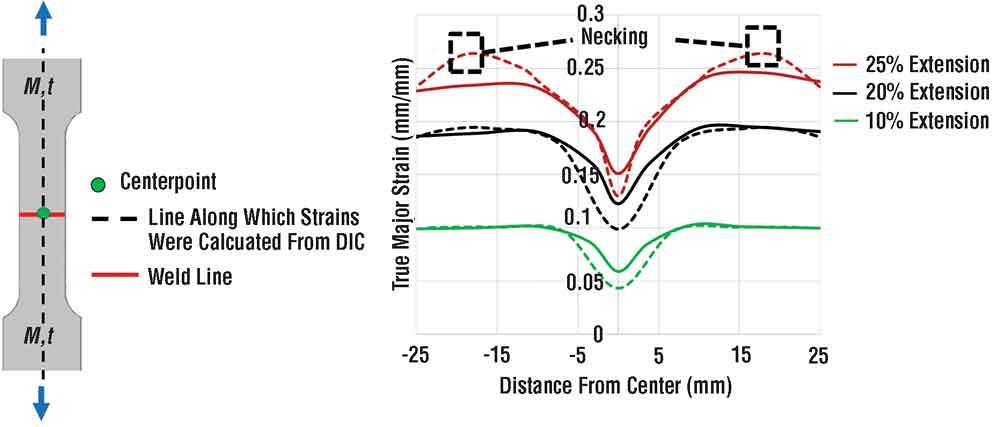
A comparison of strain distribution in the tensile test sample from DIC and simulations is shown in Figure 6. The FE simulations underpredict the strains at the weld and HAZ by up to 25% when compared to the experiments.
The strain distribution from the finite element method can be improved by changing the weld and HAZ properties that were initially assumed. The FE simulations coupled with the tensile test experiments may be a good method to estimate the HAZ and weld properties. However, the weld zone width was very small in comparison to the base material width when tensile test coupons were made per the ASTM E8 standard.
Currently the researchers are analyzing the effect of using a smaller tensile test coupon to obtain the engineering stress-strain curves and the properties of the weld and HAZ.
References
Z. Babic, S. Aleksandrović, M. Stefanović, and M. Sljivic, “Determination of tailor welded blanks formability characteristics,” Journal for Technology of Plasticity, 33(1-2), 2008.
“Advance High Strength Steel Application Guidelines,” International Iron & Steel Institute, Committee on Automotive Applications, March 2005.


Professor Emeritus and Director - Center for Precision Forming

The Fabricator is North America's leading magazine for the metal forming and fabricating industry. The magazine delivers the news, technical articles, and case histories that enable fabricators to do their jobs more efficiently. The Fabricator has served the industry since 1970.
start your free subscription
Easily access valuable industry resources now with full access to the digital edition of The Fabricator.

Easily access valuable industry resources now with full access to the digital edition of The Welder.

Easily access valuable industry resources now with full access to the digital edition of The Tube and Pipe Journal.

Easily access valuable industry resources now with full access to the digital edition of The Fabricator en Español.
In this episode of The Fabricator Podcast, Caleb Chamberlain, co-founder and CEO of OSH Cut, discusses his company’s...


