


Development Leader – Tube and Pipe
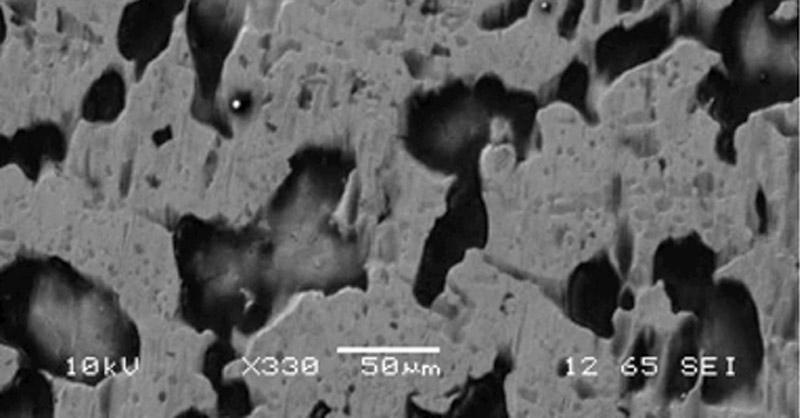
Figure 1
This surface is severely damaged from
etching. The holes are areas that have
been contaminated with oil. In general,
etching follows the grain borders of the iron
crystals where, under some conditions, localized
corrosion occurs (often pinholes).
This characteristic is easy to see, even at
limited magnification.
Forming, threading, and hydrotesting tubular goods require the use of metalworking fluids (MWF), which are usually in the form of water-soluble concentrates that contain mineral oil, synthetic oils, polymers, or a mix of all three. The primary functions of these fluids are to cool, lubricate, and help remove fines from the working area.
During the forming process, the fluids are vital to ensure that the pipe surface remains clean and blemish-free, and that the rolls are well-lubricated for long roll life. During pipe end threading, the correct MWF can significantly reduce tool wear. Research has proven that more than a 30 percent reduction in tool wear is possible, resulting in substantial cost savings. The hydrotesting stage requires the MWF to perform a different set of functions, normally described as the secondary role. In this case, the fluid has to provide good corrosion protection at low concentrations as well as remain free from biological contamination.
One key performance indicator of a MWF is corrosion protection because most tubular goods are made from unprotected hot- or cold-rolled steel, which can corrode readily depending on the alloy and end application. Furthermore, tube mills often are located in humid or corrosive environments, leaving the newly manufactured pipe vulnerable to corrosion. Pipe corrosion sometimes goes unnoticed until after the bundle has been opened by the end user, which can happen several weeks after pipe production. This puts the pipe producer at risk for significant financial losses. Analyzing the process fluids to verify that they are in good condition and free of bacteria is a practical first step in addressing this issue. A lab can provide quick results from simple corrosion tests.
To help study corrosion issues and pinpoint the causes, Quaker invested in a scanning electron microscope (SEM) and energy dispersive (X-ray) spectroscopy (EDS/EDX) equipment. The following provides a limited explanation of how SEM/EDS works and discusses its possibilities and limitations for microstructural analysis.
Generally, corrosion results from an electrochemical reaction. Many factors influence the reaction speed, including pH, oxygen, concentration, complexing chemistry, and solubility. Corrosion exists in many forms such as rust, commonly but mistakenly known as iron oxide (which is mostly black in appearance). In the tube and pipe industry, almost all of the corrosion is in the form of iron hydroxide, which is iron oxide with bound-in water (usually red-brown to yellowish in appearance). Just as steel structures have unique names such as pearlite, bainite, and martensite, these hydrated structures have specific names, such as goethite, esmeraldite, limonite, and turgite.
The presence of more noble (inert, or nonreacting) particles or sections on the surface create galvanic action. Common noble elements present on the steel surface are carbon and scale (which is iron oxide). Compared to iron, iron oxide is more noble, resulting in solution of the iron in the water phase.
An SEM uses a vacuum in which high voltage generates an electron beam. The beam, focused by electrical lenses and scanned over the surface of the substrate, generates secondary electrons that escape from the surface. The intensity of the escaping electrons depends mainly on the atomic mass of the surface and somewhat on their crystal orientation. These secondary electrons are detected and create a black-and-white image with varying intensity, just like a common black-and-white photograph.
Limiting factors that must be considered when using SEM /EDS are:
To a trained eye, corrosion on a steel sample is easy to recognize (see Figure 1, Figure 2, and Figure 3).
EDS Analyses
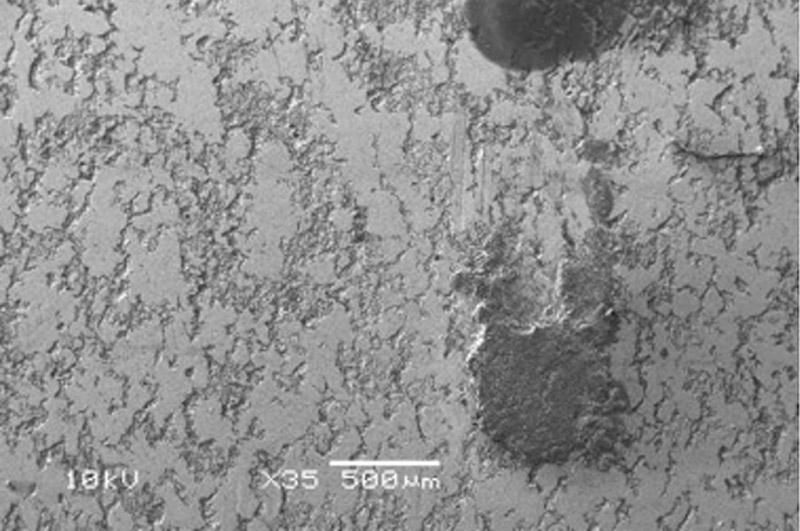
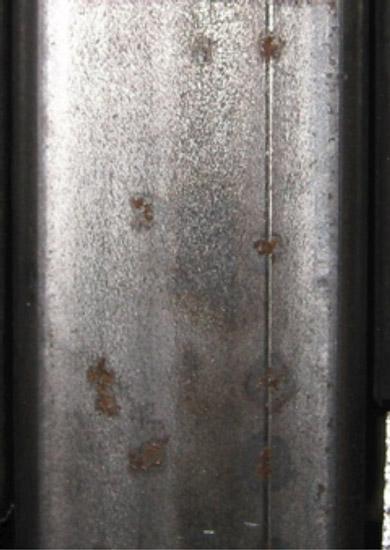
Figure 2
This surface has less damage from etching
and shows a contaminated spot. The upper
black line is from a marker. Marking the
sample helps to find corrosion locations.
When an electron beam of sufficient energy hits a surface, it creates X-ray radiation. The wavelength of the reflected energy depends on the atom that the electron beam hits. The energy from the electron beam pushes some of the object’s electrons to higher orbits; when they fall back to their original orbits, they release energy as quantum. The spectrum is X-ray and the wavelength depends on which orbit the electron returns to.
The electron beam penetrates to a known depth, meaning that the rebounding X-ray maps the substrate layer. The penetration depth is a function of the atomic weight and acceleration voltage of the electron beam. Common acceleration voltages are 10 kV and 20 kV, which penetrate iron to a depth of 2 µm and 7µm, respectively, and carbon to 3.3 µm and 10.7 µm, respectively. As a result, a mixture of carbon and iron appears more carbonlike as the acceleration voltage increases, making quantitative analysis of surface layers rather complex.
One on hand, the acceleration voltage should be minimized so that it doesn’t penetrate more than necessary. On the other, the detection capability of the X-ray spectrum at low voltage is limited, making it less reliable at detecting heavier atoms at lower voltages. When the voltage is increased, a thicker slice of the surface is analyzed and the results are dominated by the underlying substrate and not the surface. Despite the shortcomings, the EDS analysis of corroded surfaces provides insightful data.
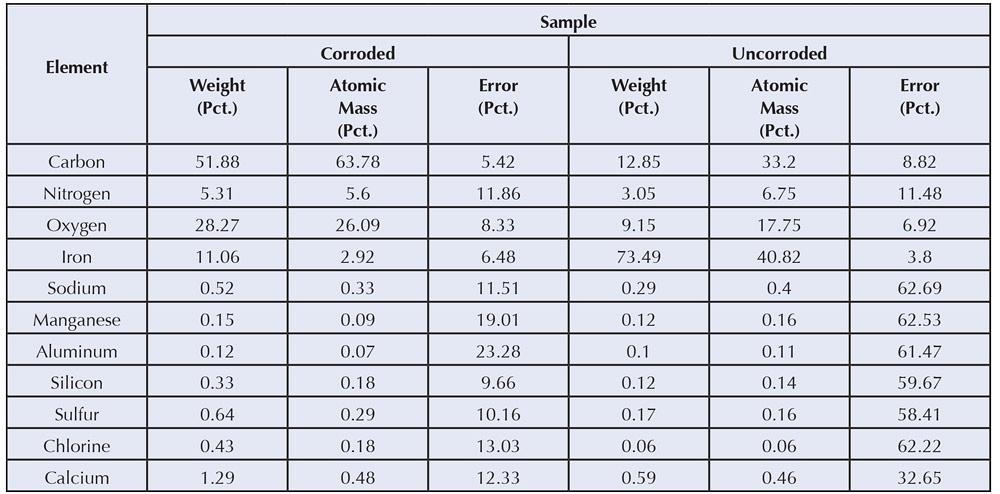
An example of EDS surface element analyses of the contaminated area (black spot on Figure 2) reveals quite a bit of information about the condition of the sample (see Figure 4).
The results are presented as weight percentages or atomic mass percentages. Things to keep in mind include:
In Figure 4 the results show high amounts of carbon, which can be explained from the organic residue on the tube. Iron may develop from rust, iron soap, or other iron structures, in addition to the steel substrate. Pure steel (cold-rolled without scale) normally shows more than 75 percent iron by weight and some carbon, usually 5 to 10 percent. This carbon does not represent the carbon in the low-carbon steel matrix, which is less than 0.4 percent, but is related to the carbon absorbed at the surface because iron has a very strong tendency to do this. Even uncorroded steel exhibits 5 to 10 percent oxygen, which comes from the natural passivation of iron in the presence of oxygen.
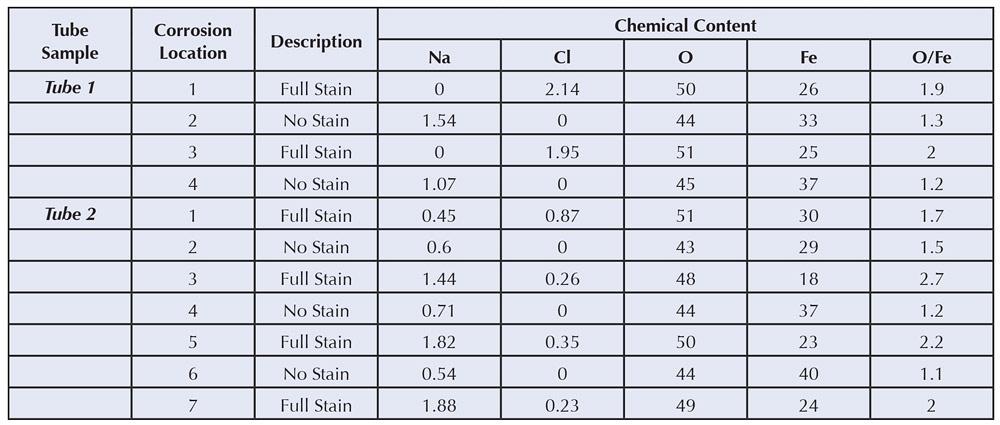
Comparing the chemistry of the corroded areas with the uncorroded areas reveals the composition of the contaminated area:
In this case, the combination of data tells us that the residues originated from calcium soaps due to an inadequate cleaning operation. These residues, combined with an excessive chlorine level in the washing fluid, caused these spots to develop. Replacing the washing fluid resolved the problem.
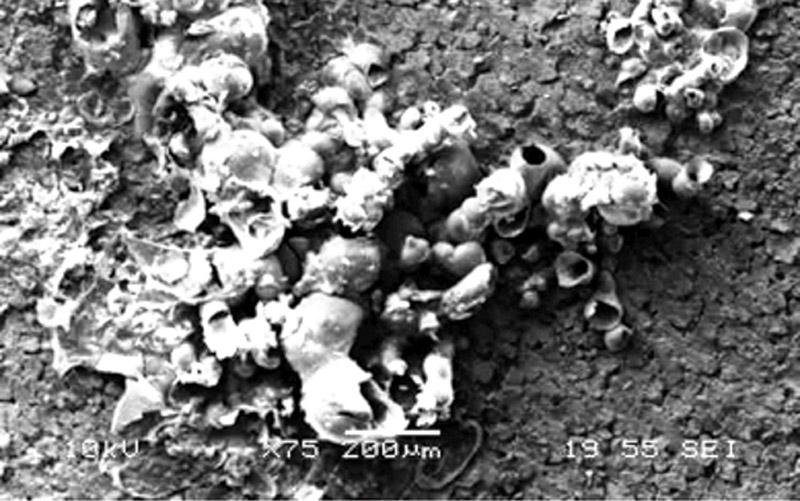
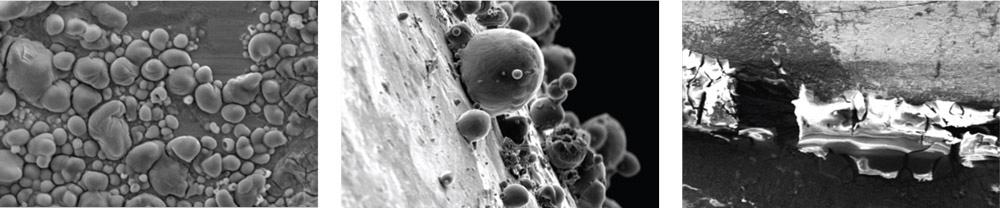
Another example shows tubes with severe staining related to bluish spots. Based on the appearance, it is immediately clear that this was not common corrosion from trapped water or simple humidity. Figure 5 and Figure 6 show a typical occurrence of scale on hot-rolled material. By nature, scale contains quite a bit of oxygen.
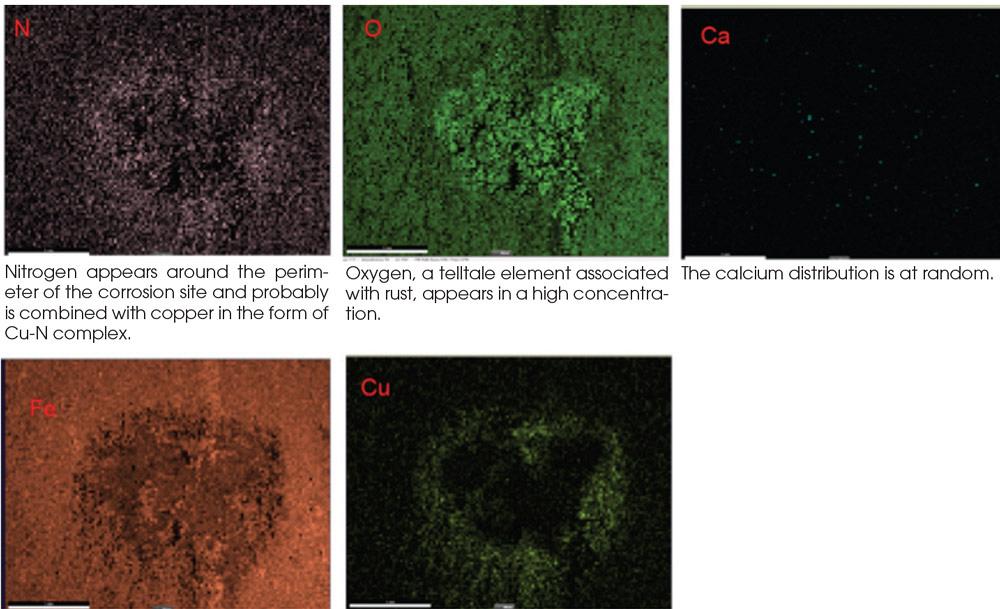
The EDS software allows image mapping of the element concentration over the SEM image (see Figure 7).
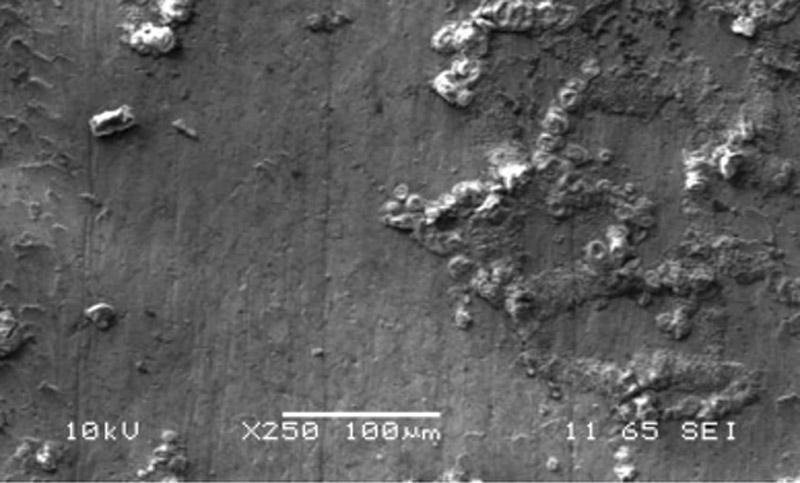
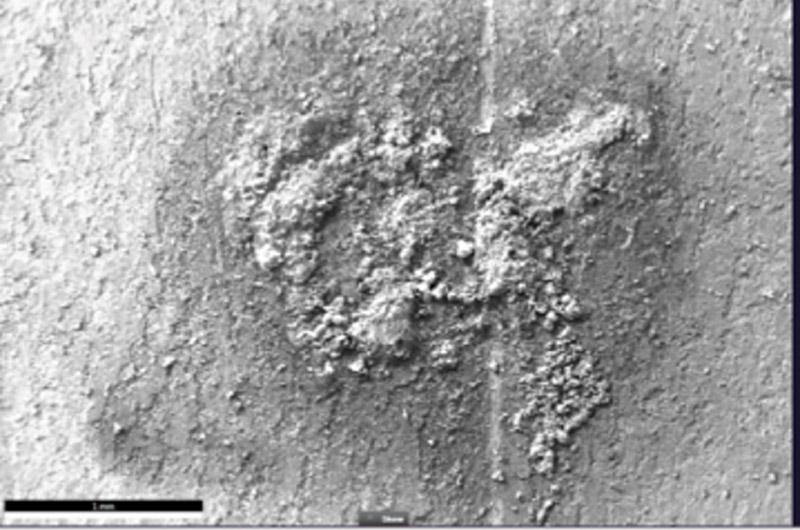
Figure 3
This surface has minimal etching. A deposit
grown on the grain borders of a common
steel alloy indicates that the corrosion was
created by open air and humidity and not
by trapped water.
Image mapping aids in analyzing the corrosion phenomena. Inductively coupled analyses on the mill coolant emulsion demonstrate that it contains quite a bit of copper, while further EDS analyses on the base metal and the scale show that they also contain abnormally high copper levels. Changing the behavior of the emulsion to improve its capability to inhibit copper solved the problem.
Hydrotesting. Hydrotesting can leave a tube vulnerable to corrosion attack (see Figure 8). Figure 9 reveals several specific phenomena.
The corrosion source was determined to be heavy contamination of the hydrotesting fluid and sodium chloride pollution from the hot-rolling process. Refining the hydrotester fluid for better corrosion resistance against chlorine ions was done by direct simulation of the corrosion process.
Ambient Humidity. The typical structure of so-called tuliplike corrosion is often seen in humid environments at modest pH (in absence of a strong vapor corrosion inhibitor [VCI]). It differs markedly from corrosion that takes on a crusty appearance when water rests on the steel’s surface, which is typical when ferrous tubes are stacked and stored outdoors and damaged by rainfall (see Figure 10).
SEM/EDS analysis is a powerful tool for finding the root cause of corrosion on steel, but the process requires great care. Sample preparation is critical and must be done carefully to prevent contamination from handling, sample preparation, and packaging. A few drops of sweat or contact with the oils normally present in a person’s skin can be enough to change the results of a chemical analysis, and the coolants or lubricants used in sawing likewise can be troublesome. All materials used for package samples should be reviewed to see if they contain any chemicals that have the potential to change the results. It is also important to examine several locations on each sample tube to achieve comprehensive and representative results.


The Tube and Pipe Journal became the first magazine dedicated to serving the metal tube and pipe industry in 1990. Today, it remains the only North American publication devoted to this industry, and it has become the most trusted source of information for tube and pipe professionals.
start your free subscription
Easily access valuable industry resources now with full access to the digital edition of The Fabricator.

Easily access valuable industry resources now with full access to the digital edition of The Welder.

Easily access valuable industry resources now with full access to the digital edition of The Tube and Pipe Journal.

Easily access valuable industry resources now with full access to the digital edition of The Fabricator en Español.
In this episode of The Fabricator Podcast, Caleb Chamberlain, co-founder and CEO of OSH Cut, discusses his company’s...


