Co-founder
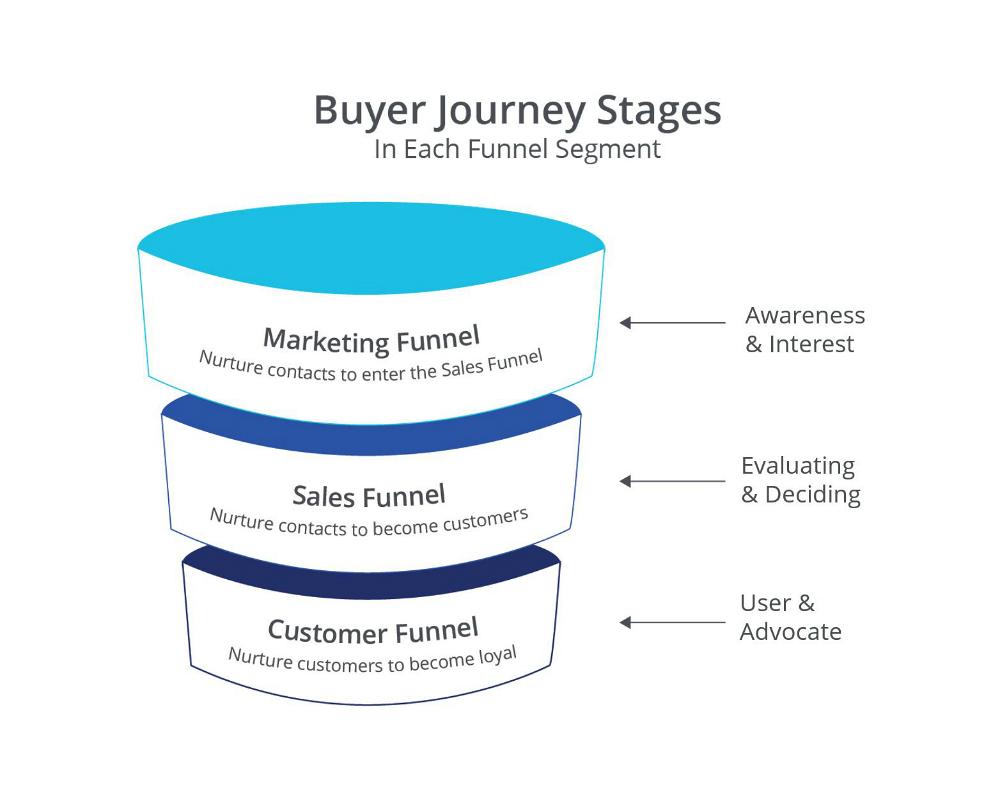
For most manufacturers, your commercial team comprises primarily marketing, sales, and customer service. KPIs should help your team improve the velocity of projects through its three funnel segments.
Note: This article on data democratization is one of the topics covered by a series of nationwide one-day meetings called Made For Manufacturers summits.
The digital transformation has continued to accelerate. Manufacturers have access to vast amounts of data from many sources. The trick is to select the right data, obtain it from the right source, and then democratize it.
In the past most data used by manufacturers came from enterprise systems and pertained to finance and production. Executives held most of the data; only a portion of it filtered down to managers and staff. Today’s digital transformation provides more data from more sources, and executives know that the company runs more efficiently when data is accessible to managers and staff.
The digital transformation enables you to create a data strategy that leverages the data you already have on hand, puts it all into one source, and democratizes it. “Data democratization means that the right information is in the hands of the right executive, manager, or employee who enables the right business decision to be made as quickly as possible,” said Paul Ausserer, CEO of Marquis Data.
“Sometimes, creating dashboards and real-time reports is easy. However, usually it is not because the data can be held in many different database locations, and the software holding the data is often not designed to present it. That’s where you have to take a step back, create the ideal strategy, prioritize what information you really need, and then put the new tools available today to work for you.”
Marketing, sales, and customer service departments have seen a dramatic increase in the capabilities of databases and software programs, the most important being customer relationship Management (CRM) software. A manufacturer’s CRM is the informational hub of the commercial team. It can support the entire buyer's journey. Within the CRM, lead-generating campaigns are launched, new leads are tracked, existing leads are nurtured to sales-ready, sales projects are closed, and customers are cultivated to become loyal customers.
Today buyers expect ultraresponsiveness. Therefore, customer-centric decisions have to be made in real time. CRM programs enable the data collection and democratization necessary to respond quickly to buyer needs.
Getting the most out of the CRM data requires you to identify your key performance indicators (KPIs). KPIs have been used for decades on the operational side of the business, and as the power of the latest CRM systems has increased, so has the use of KPIs by commercial teams. The power and complexity of these systems, such as Salesforce, HubSpot, Insightly, Zoho, and Dynamics, grows every year.
KPIs should not be a burden. They should help managers and staff improve performance. The collection and dissemination of KPI data must be as easy and resource-light as possible. Don’t track too much. Doing so can reduce your team’s efficiency and morale if they spend too much time entering data rather than serving the marketplace. Always be ready to eliminate useless KPIs;if you find the best course of action is to do nothing when a certain KPI changes, abandon that KPI.
For most manufacturers, your commercial team comprises primarily marketing, sales, and customer service. KPIs should help your team improve the velocity of projects through its three funnel segments.
The rest of this article provides a menu of KPIs to consider for each of the funnel segments. KPIs drive behavior in your organization. If you track the number of quotes delivered by a salesperson, and you push to see that number increased, you might find some salespeople begin quoting too early in the sales cycle, thereby harming the chance for success. Make sure you select KPIs that drive the behavior you require.
Marketing focuses on building brand, generating leads, and nurturing those leads to sales-ready. Before diving into tracking KPIs, make sure you have calculated these important baseline numbers:
Common marketing KPIs might include:
Of course, there are many more KPIs you could choose to employ based on your go-to-market strategy and structure.
Democratizing data for your marketing team speeds continuous improvement. Your team will learn to recognize when they are starving the top of your commercial funnel with too few leads, or when too few are becoming sales-ready.
The sales team is responsible for closing orders while hitting profit and revenue goals. The toughest part of using data to help the sales team is getting the data in the first place. Today’s CRM software systems can track all kinds of details, from the volume of phone calls, visits, and emails per day to the number of windshield hours per week. However, someone has to input the data, and salespeople, like most of us, prefer not to have every moment of every day tracked and scrutinized. In addition, field salespeople are usually working remotely, making it that much harder for managers to demand data entry.
The sales team and managers must find a balance between time spent entering data and the benefit of the resulting KPI data. Sales staff must see that moving projects through their funnel is in some ways a numbers game, and they need to clearly see the health of their territory sales funnel to be able to perform. Managers must keep the data entry to a minimum, so that the sales staff feels respected, empowered, and has time to sell.
Before working on sales KPIs, calculate the following baseline data:
Here are a few of the important KPIs you might consider. KPI tracking frequency can range from hourly to annually.
Democratize the KPIs you choose to use. KPIs are much easier to sustain if they are deemed valuable for both the salesperson and the manager.
The customer service team is responsible for maximizing the number of repeat orders and earning customer loyalty while growing revenue and profit. Customer loyalty is defined as when the customer buys all they can from you, is impervious to competition, and recommends you to others. Some of the customer service KPI data will come from the CRM software and some from the enterprise system. Wherever possible, get customer data into the hands of your customer-facing service representatives, so that they can respond instantly to the specific needs of the customer.
Some baseline calculations might be helpful before creating KPIs, such as:
Common customer service KPIs:
The customer service team interacts with both the enterprise system and CRM,which means more KPIs are possible. Driving service decisions down to your customer-facing teams can greatly enhance customer satisfaction and loyalty.
Today’s CRM systems can track and visualize most, if not all, of these KPIs. Sometimes the data needs to be pulled from multiple sources, in which case you might need help from your IT department or from an outside data expert.
In the end, the KPI must give you useful information about your funnel health that helps you manage and improve your commercial engine. The digital transformation offers more options than ever before to track performance. Democratizing the right data fuels your commercial engine.


The Fabricator is North America's leading magazine for the metal forming and fabricating industry. The magazine delivers the news, technical articles, and case histories that enable fabricators to do their jobs more efficiently. The Fabricator has served the industry since 1970.
start your free subscription
Easily access valuable industry resources now with full access to the digital edition of The Fabricator.

Easily access valuable industry resources now with full access to the digital edition of The Welder.

Easily access valuable industry resources now with full access to the digital edition of The Tube and Pipe Journal.

Easily access valuable industry resources now with full access to the digital edition of The Fabricator en Español.
In this episode of The Fabricator Podcast, Caleb Chamberlain, co-founder and CEO of OSH Cut, discusses his company’s...