


President

When a mass production veteran buys a custom fab shop, he quickly learns that just because a job shop is small doesn’t mean it’s easy to manage. Getty Images
The following narrative covers a 40-person job shop that fabricates sheet metal parts and assemblies for a variety of sectors. Before purchasing the company, the current owner had managed a mass production operation for years. That new owner picks up the story from here.
I’ve come a long way since coming to Diversified Fabricators Inc. (DFI). I’ve endured many sleepless nights after days spent fighting fire after fire. I sleep better now, thankfully. I don’t spend my days managing stressed people and apologizing to angry customers. My days now are less chaotic and more productive. Most important, the business is on the right track. Here’s how I got there.
My day starts with a quick stand-up meeting with my key people. Having people stand (rather than settle in around a conference table) helps keep these meetings brief and productive. We meet to update everyone on current sales, monitor order progress, identify problems, discuss goals for the day, and evaluate performance on recently shipped orders.
During the meeting we review a matrix that helps us easily compare key performance metrics (see Figure 1). We do this every day for the orders shipped the previous day. This makes the task manageable so we don’t get overwhelmed.
Today I assigned one of my key people to find out why one order was late and over budget and to report on her findings in the next day’s meeting. I always set a time for a follow-up (as soon as practical) and when I expect to see results—tomorrow, in this case.
On Fridays we review a weekly performance report (WPR) that provides metrics across the entire business process (see Figure 2). Every week the WPR gives us critical operational and financial performance information. Obviously, the faster we recognize a problem, the faster we can act to solve it. In this way the WPR functions as our early warning system. It also graphs each of the key indices so we can monitor trends and cycles.(For more on this, see How to track success in the job shop.)
We started using the WPR this year after realizing that all the information in our financial statements could be six weeks old or even older. By the time we saw them, they were ancient history. We realized that if something in the business were to go south, using six-week-old information could make the situation worse. Better to jump on it right away rather than waiting a month or more to discover a large loss on the income statement.
The balance of the day I spend on normal job shop managerial activities. I take a walk around the floor midmorning and midafternoon to see what’s going on, chat with people, and answer questions. (For more on this, see How metrics drive a job shop’s continuous improvement.)
Always looking for ways to make the business better, I normally have two or three continuous improvement projects going on at one time. Currently we’re just finishing a study on our quoting effectiveness.
We worked with Josh, a college student who’s here on a work study program, to build a quoting database. We wanted to uncover how much business we’re getting from our customers, what percentage of quotes we won, and where to redirect our efforts.
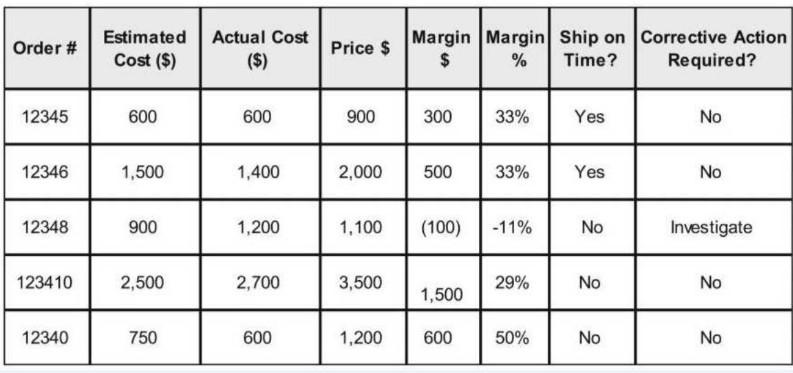
FIGURE 1 We review a job performance matrix every day for orders shipped the previous day. Performing a quick review daily makes the task manageable, so we don’t get overwhelmed.
The information we found (see Figure 3) showed win rates by selected customers. We presented information in terms of dollars and number of quotes won, as well as the average size of orders won and average request-for-quote (RFQ) size.
We found we were just wasting our time with one customer (Sigma in Figure 3); we submitted 99 quotes and won nothing. For another customer (Beta) we submitted 135 quotes to win a measly $1,900, giving us a win rate of only 4.9%. Our average win rate is 22%.
The analysis gives us information on where to direct our improvement efforts. Specifically, we want to target large customers that fall below our average win rate to determine if there is more potential and how to achieve it. One customer (Epsilon in Figure 3) submitted over $1 million in RFQs, but we won only 12.6% of that business. If we were to reach our average win rate of 22% with this customer, we’d yield $243,862, which is about $104,000 more than what we get now. What do we need to do to increase the win rate with this and other large customers? That’s where we’re focusing our improvement efforts.
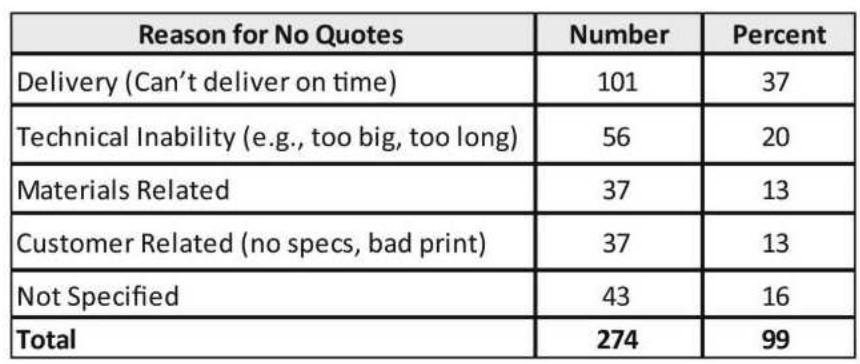
Josh and I also wanted to find how many RFQs we didn’t quote and why. We found that we chose not to quote 101 RFQs because we could not deliver on time (see Figure 4). That didn’t surprise me, because I’ve made it a policy not to quote any order that we cannot deliver by the customer’s requested date. The last thing I want is for my salespeople to quote a job with a too-short lead time, win the order, then throw it over the wall for the shop to handle.
After all, I have seen the chaos that occurs when more orders are thrown into an already overloaded shop floor. To satisfy our promised ship dates, we moved work around, stopped and started jobs, tore down already-set-up (but not completed) jobs, worked too much overtime, and generally robbed Peter to pay Paul. It didn’t work and cost us a fortune—and all those costs essentially were invisible to us and did not add value for the customer.
We found 274 other RFQs we didn’t quote for other reasons (detailed in Figure 4). Like our win-rate study, this no-quote analysis pinpointed potential areas for improvement, but it also verified just how effective our quoting process really was.
Our quoting wasn’t always so effective. We used to quote nearly every job that came in the door, and I witnessed all the trouble it caused, including extraordinarily low win rates. Quoting problematic RFQs wound up costing us more money than it was worth—especially during the slow times, when we rationalized taking on no-profit orders by telling ourselves, “Well, at least it pays the light bill.” They mostly just cost us money, and they certainly didn’t pay the light bill. For more on this, see 3 rules for job shops to follow to avoid unprofitable work.)
We also have an improvement project to shorten our lead times. Rather than using a standard lead time, we quote delivery dates for each order. We also focus on delays. We don’t just look at one machine or process, but our entire quote-to-cash cycle, then shorten or eliminate the delays we find. (For more on this, see How to cut lead times in job shops.)
We realized that “processes” don’t just take place in a machine workcell; they span the entire business, from quotes to cash. This helps us keep our eye on the big picture.
Before we did this, we’d work to squeeze every bit of productivity out of our machines, but to our dismay, our lead times stayed the same and our delivery performance didn’t budge. Once we considered our entire business process, however, we finally made real progress.
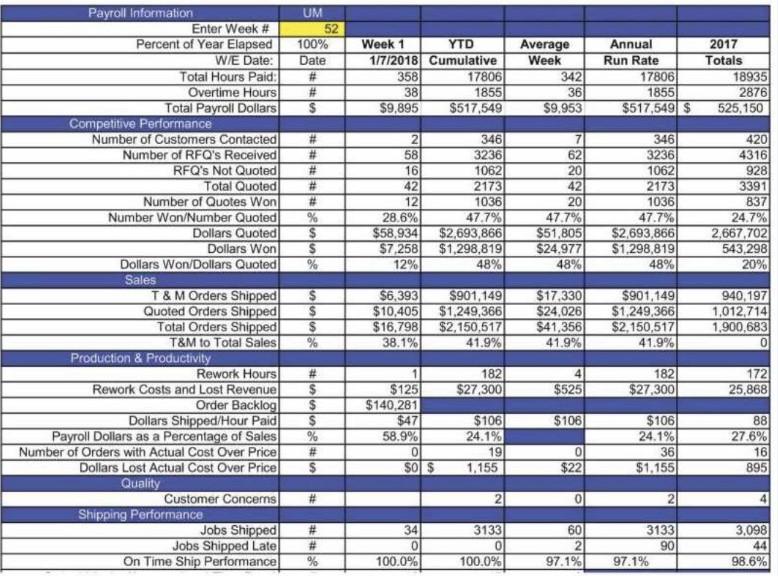
FIGURE 2 The weekly performance report (WPR) incorporates key metrics like rework, shipping performance, and dollars shipped per hour.
For instance, while we found that our machines were extraordinarily productive, our order entry process was anything but. In fact, we relied on one person who reviewed and released all orders to the shop, and his inbox was always overflowing. We restructured our order-entry process, cross-trained, and, lo and behold, our average lead time shortened dramatically.
In fact, we’ve done a lot more than restructure the order-entry process. We’ve actually restructured our entire business. And this isn’t the corporate-speak “restructuring” that’s code for “downsizing.” It came to fruition by thinking about the business in a new way.
When I took over this business , I never felt like I was fully in control. We had too many surprises. One crisis followed another. So, I began to think differently about my business and how it works.
Our company’s mission is to deliver on time and within budget in the shortest time possible. I thought about it for a bit. Our company had your typical functional hierarchy, with different functions—sales, purchasing, manufacturing, quality, engineering—all reporting to me. As such, everyone came to me if they had a problem involving people who weren’t their direct reports. What caused these communication issues? It occurred to me that our org chart didn’t sync with the job shop business process, from lead generation through shipping a completed product to a customer. So, why not organize the business around this process? (For more on this, see A new look at the job shop organization chart, archived at TheFabricator.com.)
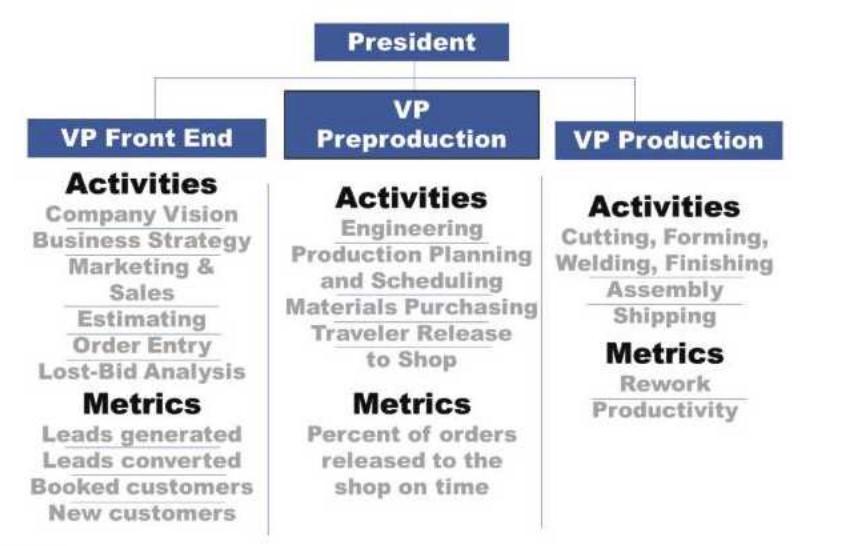
Today we have three core areas of the business (see Figure 5). The front end involves sales and marketing, quoting, and order entry. Preproduction includes engineering, production planning and scheduling, materials acquisition, and order release. And finally we have production, which consists of our fabrication processes (punching, cutting, bending, and welding), final assembly, and shipping.
This new way of organizing the business meant that my executive team—my vice president of front-end processes, VP of preproduction, and VP of production—can manage their portion of the job shop business process directly. They also work to achieve metrics that help orders flow through the business (see Figure 6).
Metrics are tied directly to the executive responsible for that component of the process. So, what’s my metric? I’m responsible for building an organization that can deliver jobs on time and on budget. That happens only if everyone in the company plays their part, and as president, it’s my job to make sure that they do.
This new organizational design has improved how we operate, and although it has been in place only a short time, I can already see a difference in performance and accountability. Also, scheduling is more stable now that we can control the flow of orders more directly. (For more on this, see Are scheduling problems really symptoms?)
Late shipments have dropped dramatically since we instituted our preproduction department, which completes all tasks necessary before an order is released to the production floor. Previously the people performing these tasks were scattered throughout the company, and no one was responsible for releasing orders to the floor on time. When orders were released late, they were more likely to ship late because, of course, the promised delivery date didn’t change.
Now everyone in preproduction is under the aegis of a senior manager, and we schedule a due date for the order release to the floor. They all work toward a common goal: 0% of orders released late to the floor. They’re not there yet, but they’re making progress.
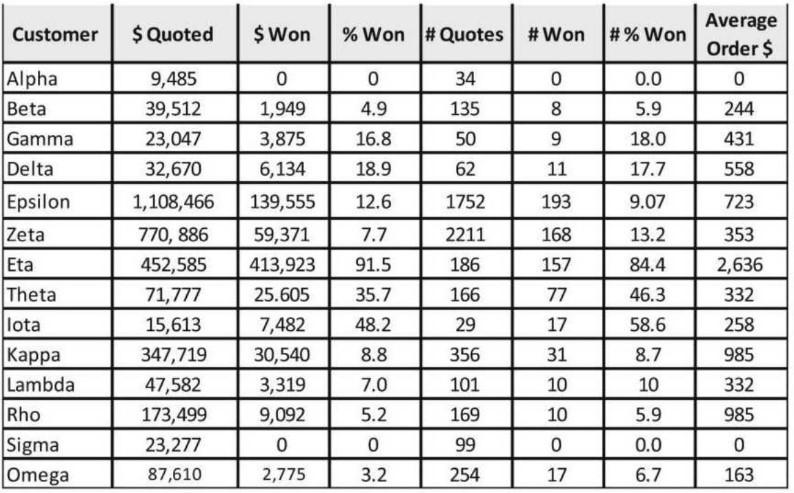
FIGURE 3 This report shows our win rates with selected customers.
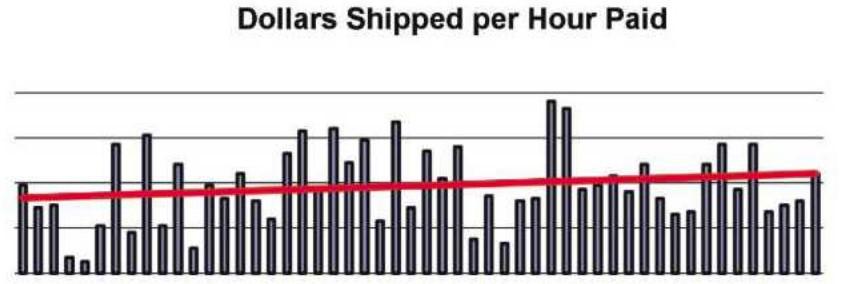
We measure productivity in production by dollars shipped per hour paid. Note that the absolute number might vary somewhat, especially if some jobs use expensive material or a lot of purchased parts. Still, we don’t separate material and parts costs from the dollars-shipped-per-hour-paid metric, because we’re really not interested in the absolute number. We’re more interested in the trend over time (see Figure 7).
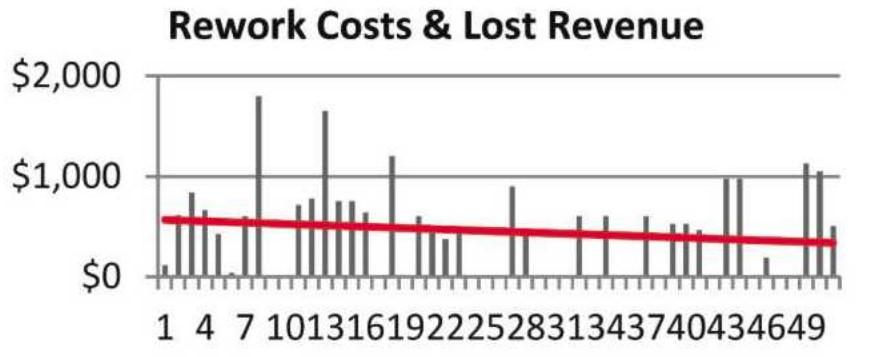
Another production metric is rework, which comes with the territory in a job shop. After all, we are making different things all the time, and sometimes this involves making mistakes. Still, rework is the most expensive form of waste in a job shop, costing far more than the hours spent on it. We pay to make it wrong; pay to undo what was made wrong; pay to redo what was undone; pay for the cost of scrap; and pay for the cost of delays and lost production. We also pay the opportunity costs as rework eats up capacity we could otherwise sell. And we pay for lost productivity from distracted employees, with everyone rubbernecking to see the latest fire we’re putting out.
We used to think a problem as “solved” when it no longer exists. We found, however, that some problems cannot be eliminated, only ameliorated. Rework falls into this category. We realized that if we saw rework as a problem to eliminate, we’d fail. We don’t ignore it; rather, we analyze instances of rework to determine causes, then implement new policies or procedures to prevent similar mistakes in the future. It’s an ongoing effort, and we measure success with a negative trend. When we see rework costs declining, we’re heading in the right direction (see Figure 8).
After several years leading DFI, I’ve come to understand one immutable fact: Our job shop is an order-driven business, and it’s nothing like mass production. Improvement strategies geared toward mass production were utterly ill-suited for our operation. A job shop is a unique animal. For me, understanding that fact has been half the battle.
This article, a fictional narrative inspired by real-world events, reviews a number of concepts from the author’s past articles, which can be accessed by clicking here.


The Fabricator is North America's leading magazine for the metal forming and fabricating industry. The magazine delivers the news, technical articles, and case histories that enable fabricators to do their jobs more efficiently. The Fabricator has served the industry since 1970.
start your free subscription
Easily access valuable industry resources now with full access to the digital edition of The Fabricator.

Easily access valuable industry resources now with full access to the digital edition of The Welder.

Easily access valuable industry resources now with full access to the digital edition of The Tube and Pipe Journal.

Easily access valuable industry resources now with full access to the digital edition of The Fabricator en Español.
In this episode of The Fabricator Podcast, Caleb Chamberlain, co-founder and CEO of OSH Cut, discusses his company’s...


